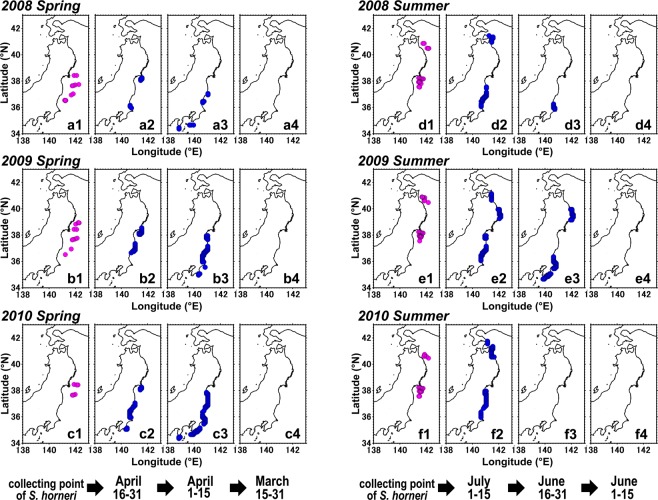
Figure 7.
Numerically estimated origins of Sargassum horneri (blue dots) caught by bottom trawling in spring and summer of 2008 (upper panels: a, d), 2009 (middle panels: b, e) and 2010 (lower panels: c, f), respectively. Left (1) columns are trawl stations where S. horneri was collected in spring and summer, respectively. Columns (2), (3) and (4) are origins determined for 1–14 d, for 15–30 d, and for >30 d before the collection date of S. horneri debris, respectively. The maps were generated using Matlab R2011b (https://www.mathworks.com/products/matlab).

