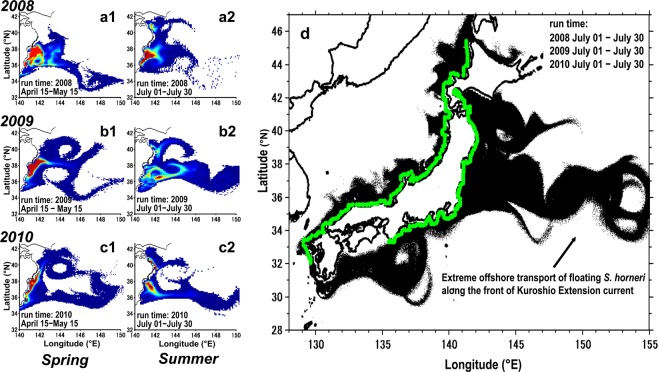
Figure 8.
Accumulation zone of Sargassum horneri estimated by forward-in-time particle-tracking. One thousand particles were released from each estimated origin on April 15 (spring) and July 1 (summer) and traced for 30 d. Each day’s position of the particles was regarded as an accumulation zone of floating S. horneri in 2008 (upper panels: a1, a2), 2009 (middle panels: b1, b2) and 2010 (lower panels: c1, c2), respectively for spring and summer. Number of particles per unit area with high density is shown in red, and low density in blue. (d) Possible accumulation zones of floating S. horneri (black) transported from their previously reported benthic habitats along the Japanese coast (green). Particles were released from their initial position (green) on July 1 and traced for 30 d, in 2008, 2009 and 2010, respectively. Each day’s position of the particles for the three years were pooled and regarded as an accumulation zone of floating S. horneri in summer. The maps were generated using Matlab R2011b (https://www.mathworks.com/products/matlab).

