Figure 6.

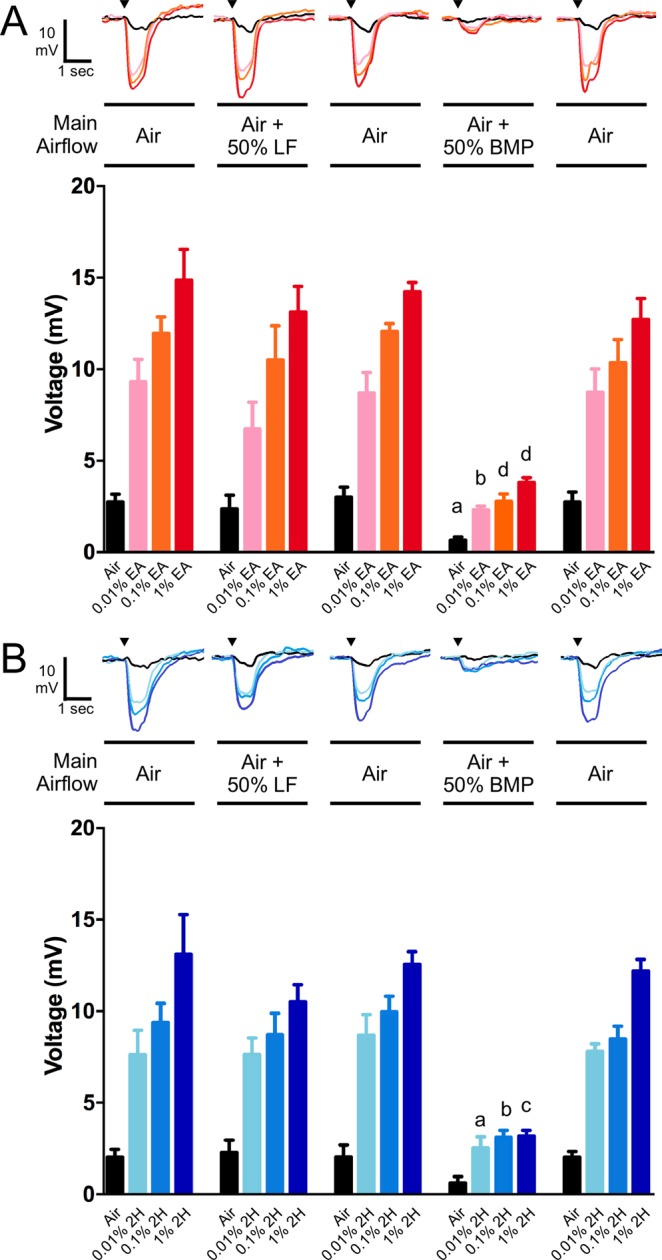
Inhibition of odorant induced EAG responses of fruit fly antennae by an Orco antagonist. (A) Top, EAG recordings from a single insect exposed sequentially to stimulus pulses of air, 0.01% EA, 0.1% EA and 1% EA. The stimulus pulse set was repeated with the main airflow containing air, air + 50% LF, air, air + 50% BMP, air. Bottom, graphic representation of repetitions (n = 3–5) of the experiments shown above. Data are presented as mean ± SEM. (B) Top, EAG recordings from a single insect exposed sequentially to stimulus pulses of air, 0.01% 2 H, 0.1% 2 H and 1% 2 H. The stimulus pulse set was repeated with the main airflow containing air, air + 50% LF, air, air + 50% BMP, air. Bottom, graphic representation of repetitions (n = 3) of the experiments shown above. Data are presented as mean ± SEM. Statistical analysis: The stimulus pulses of each type (air, 0.01% EA, etc.) were compared by one-way ANOVA and Dunnett’s multiple comparison test. For comparison to the stimulus pulse in the first main airflow set (Air): a, p < 0.05; b, p < 0.01; c, p < 0.001; d, <0.0001.
