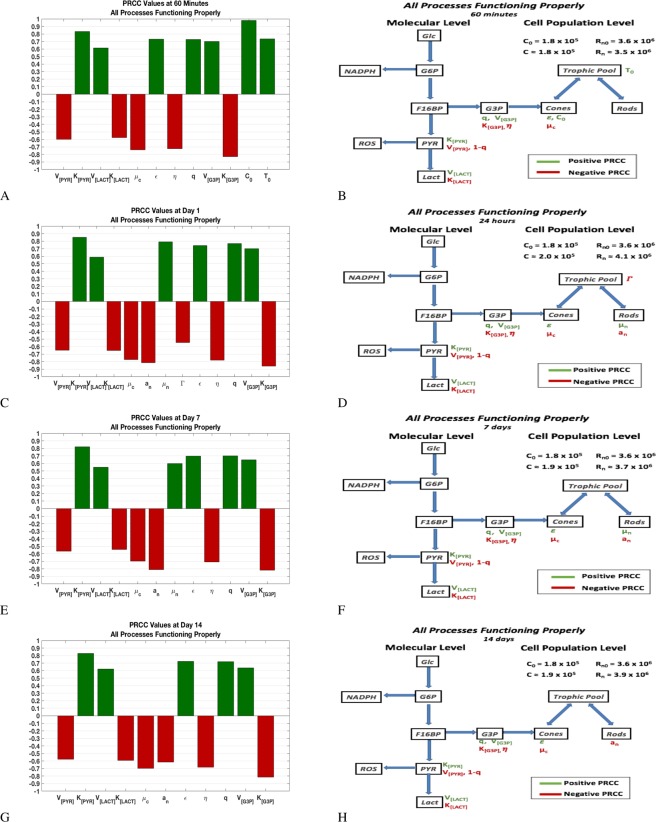
Figure 7.
PRCC plots and corresponding effects for a retina in which all processes are functioning properly. The left panels give the partial rank correlation coefficient (PRCC) plots for parameters with significant PRCC values while the right panels give the location of those parameters in the flow diagram. The value of C and Rn at the given time snapshot are given in the right panels. The PRCC values are given in Table 15 (in Supplemental Information). See Sections 4.2 and 2.5 for details on PRCC analysis.

