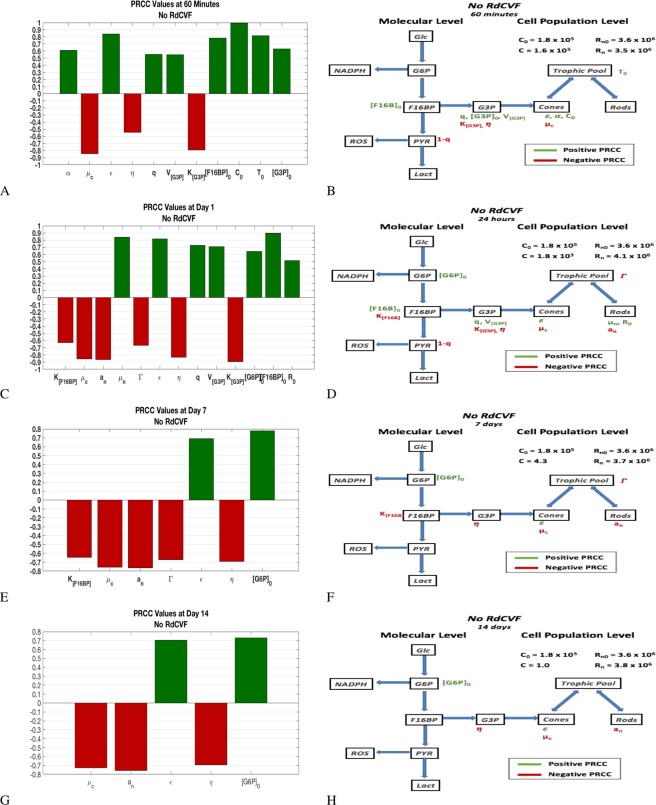
Figure 9.
PRCC plots and corresponding effect on flow diagram in the absence of RdCVF. The two top panels, (A and B) are for 1 hour, the next two panels, (B and D), for 1 day, the next two panels, (E and F), for 7 days, and the two bottom panels, (G and H), are for 14 days. The left panels give the partial rank correlation coefficient (PRCC) plots for parameters with significant PRCC values while the right panels give the location of the significant PRCC quantity in the flow diagram. The value of C and Rn at the given time snapshot are given in each of the figures in the right panel and C is basically non-existent by day 7 in this scenario. The PRCC values are given in Table 18 (in Supplemental Information). See Sections 4.2 and 2.5 for details on PRCC analysis.

