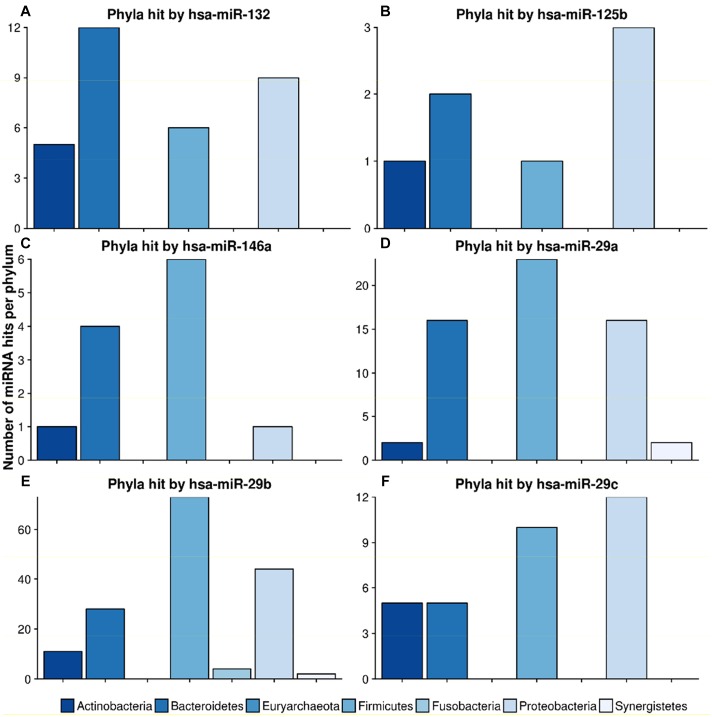
FIGURE 7.
Number of hits from specific miRNAs per phylum. The bar plots show the number of hits from miRNAs (A) hsa-miR-132, (B) hsa-miR-125b, (C) hsa-miR-146a, (D) hsa-miR-29a, (E) hsa-miR-29b and (F) hsa-miR-29c counted for different phyla. The legend can be found at the bottom. The colors refer to different phyla.

