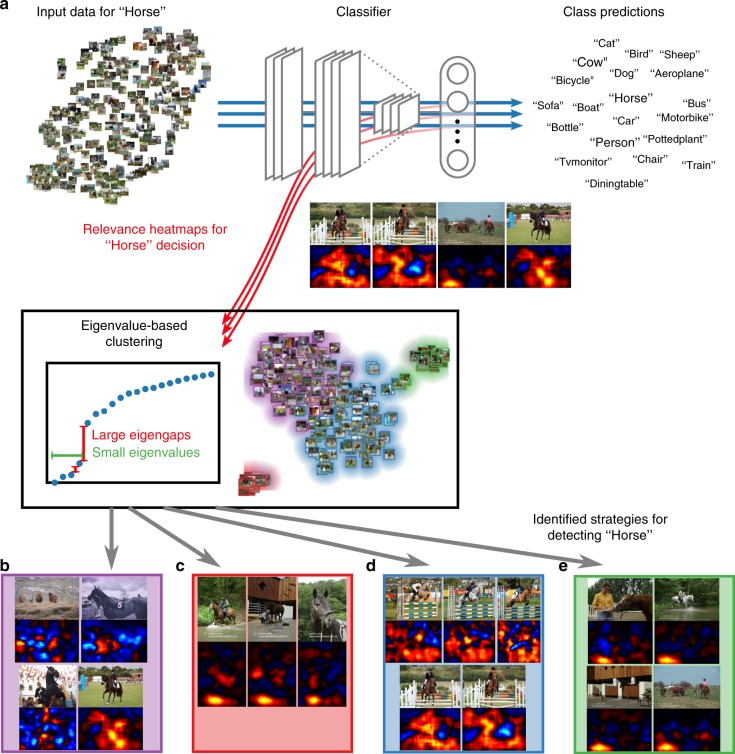
Fig. 3.
The workflow of spectral relevance analysis. a First, relevance maps are computed for data samples and object classes of interest, which requires a forward and a LRP backward pass through the model (here a Fisher vector classifier). Then, an eigenvalue-based spectral cluster analysis is performed to identify different prediction strategies within the analyzed data. Visualizations of the clustered relevance maps and cluster groupings supported by t-SNE inform about the valid or anomalous nature of the prediction strategies. This information can be used to improve the model or the dataset. Four different prediction strategies can be identified for classifying images as “horse”: b detect a horse (and rider), c detect a source tag in portrait oriented images, d detect wooden hurdles and other contextual elements of horseback riding, and e detect a source tag in landscape-oriented images

