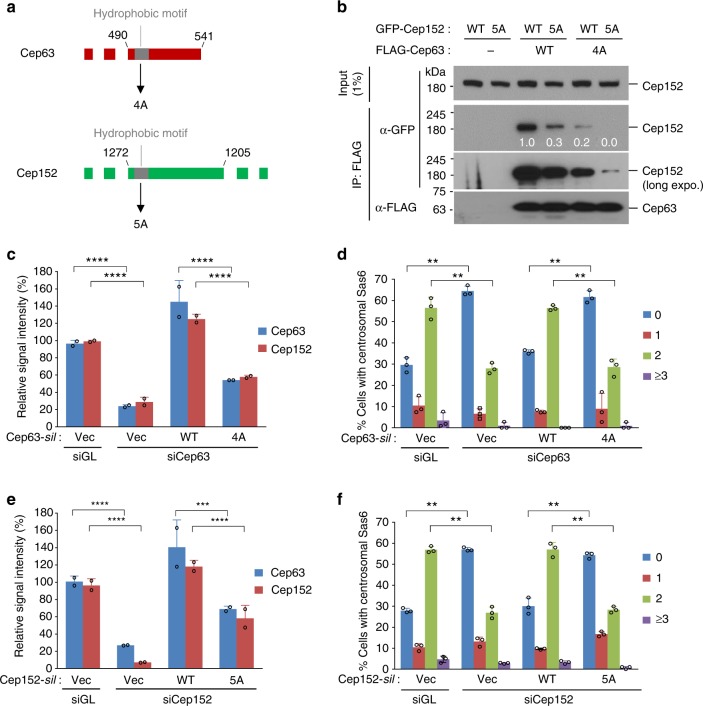
Fig. 4.
Hydrophobic motifs promote the localization and function of Cep63 and Cep152. a Schematic diagram illustrating the hydrophobic motifs (gray boxes) present in Cep63 P1b and Cep152 M4e. b Immunoprecipitation (IP) and immunoblotting analyses using transfected HEK293 cells. Numbers, relative signal intensities. c–f Analysis of U2OS cells stably expressing the indicated constructs after silencing for luciferase (siGL), Cep63 (siCep63), or Cep152 (siCep152). The resulting cells were immunoblotted and immunostained (see Supplementary Fig. 4d–i). Relative fluorescence intensities of centrosome-associated Cep63 or Cep152 were quantified from three independent experiments (≥70 cells per experiment) (c, e). The number of the centrosomal Sas6 per cell was quantified from three independent experiments (≥200 cells per experiment) (d, f). Error bars, s.d.; **P < 0.01; ***P < 0.001, ****P <0.0001 (unpaired two-tailed t test)

