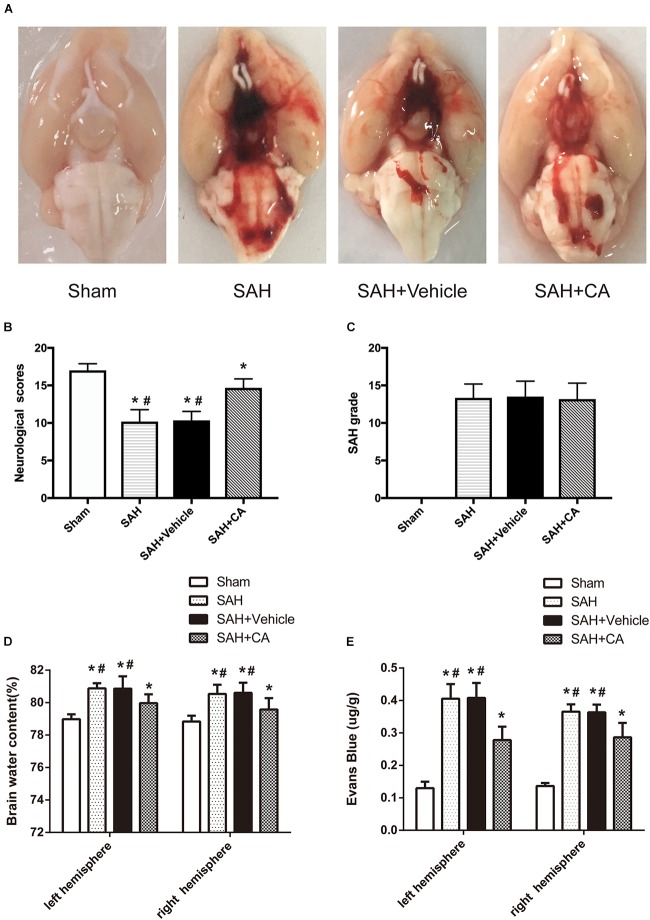
FIGURE 2.
Typical representation of brains from each group and SAH grade, neurological scores, brain water content, and Evans blue dye extravasation at 24 h after SAH. (A) Representative brains from the sham, SAH, SAH + vehicle, SAH + CA group. (B) Quantitative analyses of neurological scores. The bars represent the mean ± SD. n = 30. (C) Quantitative analyses of SAH severity. The bars represent the mean ± SD. n = 30. (D) Quantitative analyses of brain water content. The bars represent the mean ± SD. n = 6. (E) Quantitative analyses of Evans blue dye extraversion. The bars represent the mean ± SD. n = 6. ∗#P < 0.05 vs. Sham, ∗P < 0.05 vs. SAH.

