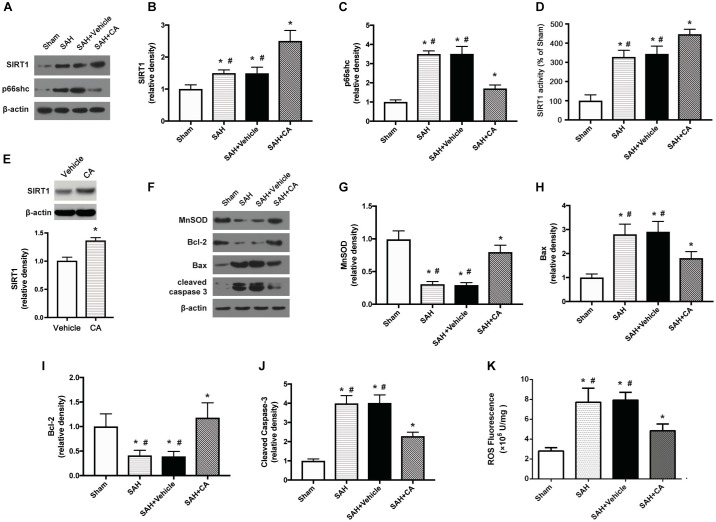
FIGURE 3.
Carnosic acid attenuated apoptosis 24 h after subarachnoid hemorrhage (SAH) via activating SIRT1/p66shc signaling pathway. (A) Representative Western blot bands of SIRT1, p66shc. (B,C) Quantitative analyses of SIRT1 (B), p66shc (C). (D) Activity of SIRT1 in the brain. (E) The effect of CA on SIRT1 expression. (F) Representative Western blot bands of MnSOD, Bax, Bcl-2, and cleaved caspase-3. (G–J) Quantitative analyses of, MnSOD (G), Bax (H), Bcl-2 (I), cleaved caspase-3 (J). The densities of the protein bands were analyzed in relation to β-actin and normalized to the sham group. (K) Quantitation of ROS. The histograms represent the median with interquartile range, n = 6. The statistical differences between two groups were analyzed by Kruskal–Wallis test. ∗#P < 0.05 vs. Sham, ∗P < 0.05 vs. SAH.

