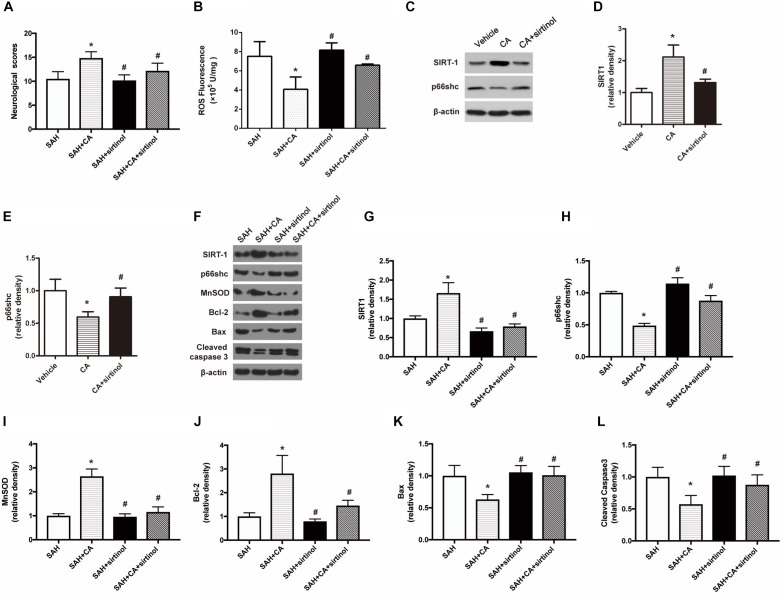
FIGURE 5.
SIRT1 inhibitor sirtinol abolished the beneficial effect of carnosic acid on apoptosis. (A) Quantitative analyses of neurological scores. The bars represent the mean ± SD. n = 18. (B) Quantitative analyses of ROS. The histograms represent the median with interquartile range, n = 6. (C–E) Western blot assay and quantitative analyses of SIRT1 (D), p66shc (E) in PC12 cells after treatment with CA alone or together with sirtinol. ∗P < 0.05 vs. Vehicle, #P < 0.05 vs. CA. (F–L) Western blot assay (F) and quantitative analyses of SIRT1 (G), p66shc (H), MnSOD (I), Bcl-2 (J), Bax (K), cleaved caspase-3 (L) expressions in ipsilateral cortex. The densities of the protein bands were analyzed in relation to β-actin and normalized to the sham group. The bars represent the mean ± SD. n = 6. ∗P < 0.05 vs. SAH, #P < 0.05 vs. SAH + CA.

