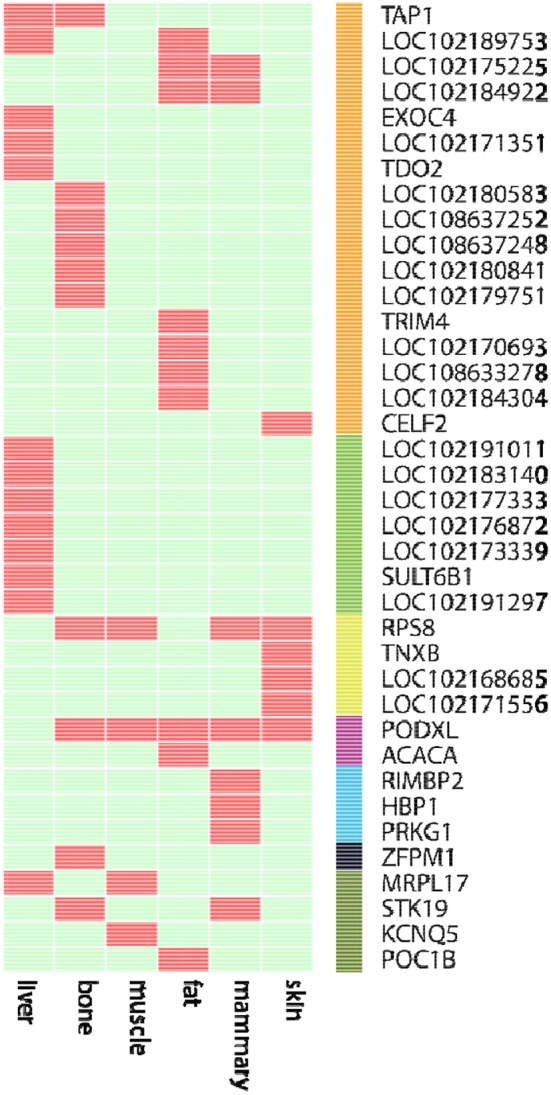
Figure 3.

The 38 core-ASE genes and their functions. Red and light green indicate the presence and absence, respectively, of genes with ASE (rows) in the corresponding tissues (columns). The right bar indicates the biological functions of the corresponding genes (Orange: immune responses; green: metabolism; yellow: adaptation to hot and humid environments; purple: functions associated with body measurements and weight; cyan: cell regulation metabolism; black: hematopoiesis; dark green: undefined).
