
FIGURE 8.
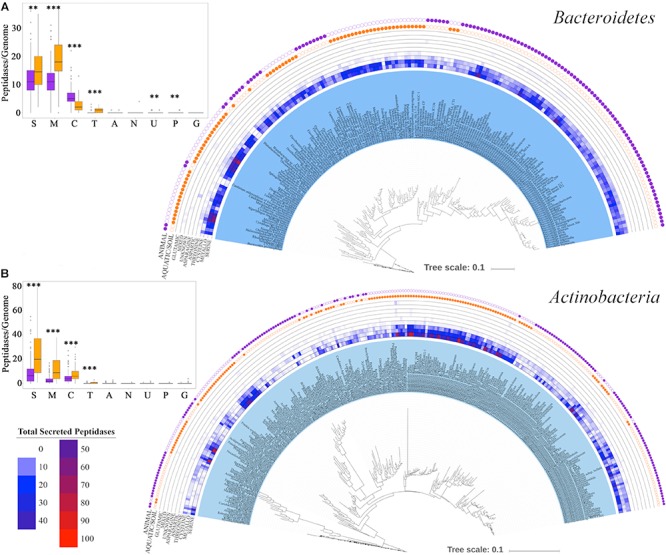
Distribution of strain-specific secreted peptidases across (A) Bacteroidetes and (B) Actinobacteria taxa. The outer two tracks represent the habitat each taxon is associated with (orange for aquatic/soil environment, purple for animal environment). The middle tracks show the copy number of genes from each secreted peptidase super-family in each genome. The figure on the top left corner represent the average number of each peptidase super-family (S for serine, M for metallo-, C for cysteine, T for threonine, A for aspartic, N for asparagine, U for unknown, P for mixed and G for glutamic) per genome; purple box plots report mean and standard deviation of the peptidase content of genomes that are commonly found in animal-associated environments, and orange box plots report mean and standard deviation of the peptidase content of genomes from soil/aquatic environments, ∗∗∗p = 0–0.001 and ∗∗p = 0.001–0.01.