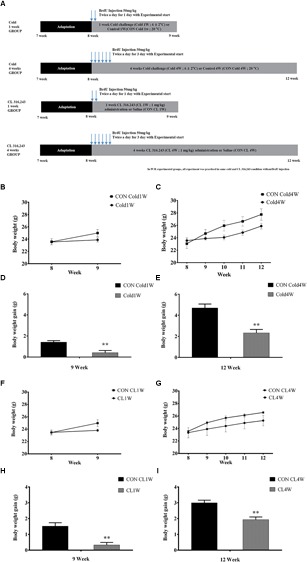
FIGURE 1.

Schematic demonstration of the experimental design (A) and effects of cold challenge or CL 316,243 treatment on body weight (B,C,F,G) and body weight gain (D,E,H,I) during experimental periods. Body weight and body weight gain changed with age and after cold challenge or CL 316,243 treatment for 1 week or 4 weeks (n = 5 per group). ∗∗ indicates a significant difference compared with the control group (p < 0.01). Data are shown as mean ± or + standard error of means (SEM).
