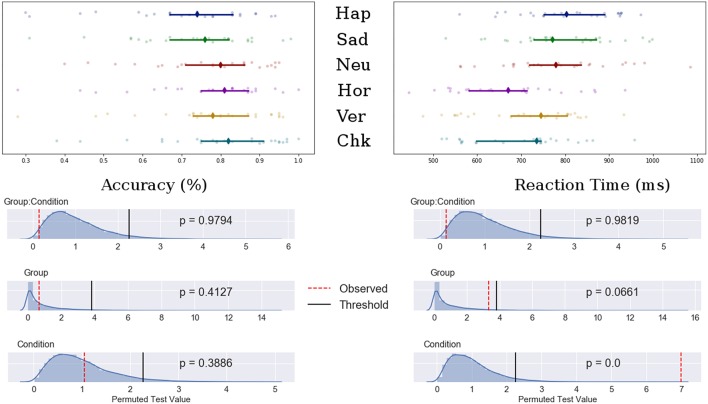
Figure 2.
Top: Median value for accuracy (Left) and reaction time (Right) for happy, sad, neutral, horizontal, vertical, and checked conditions. Bars indicate 95% confidence interval bootstrapped 10,000 times, points represent individual participant data. Bottom: Permuted null distribution with observed (red) and threshold (black) values marked as vertical bars.

