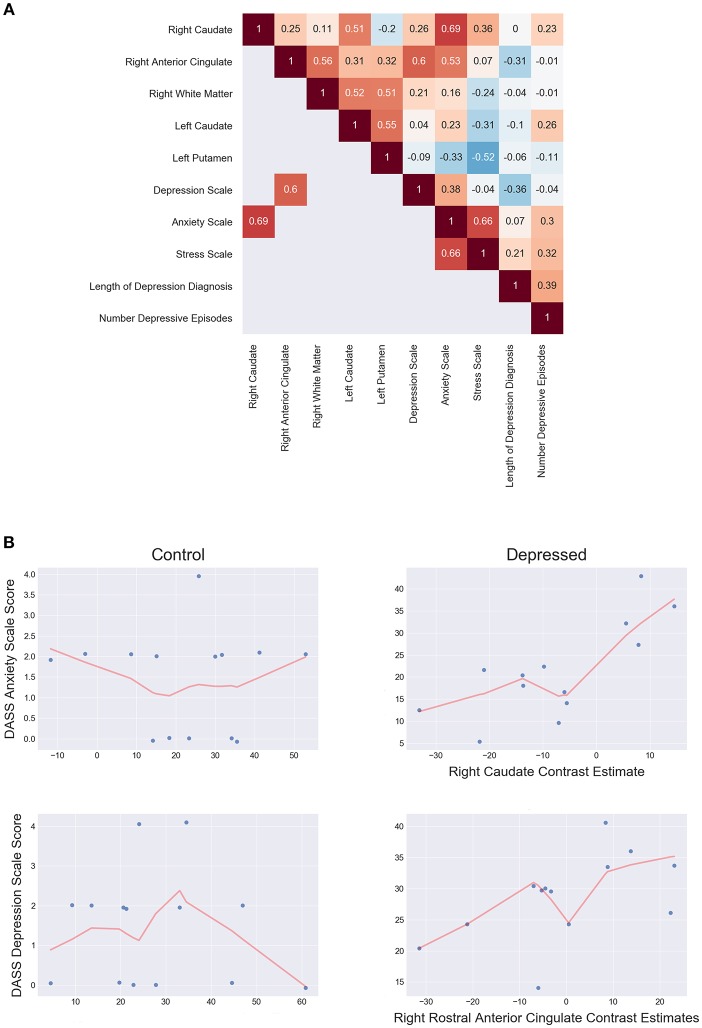
Figure 5.
(A) Depressed correlation matrix of Spearman's ρ shows unthresholded correlations in the top triangle and thresholded (p < 0.05 two tailed) correlations on the bottom. (B) Scatterplots of controls (left) and depressed (right) for DASS anxiety scale score and right caudate estimates (top) and DASS Depression scale score and right rostral anterior cingulate estimates (bottom). LOESS line (red; fraction = 0.5) indicates the direction of the monotonic relationship.

