Figure 4.
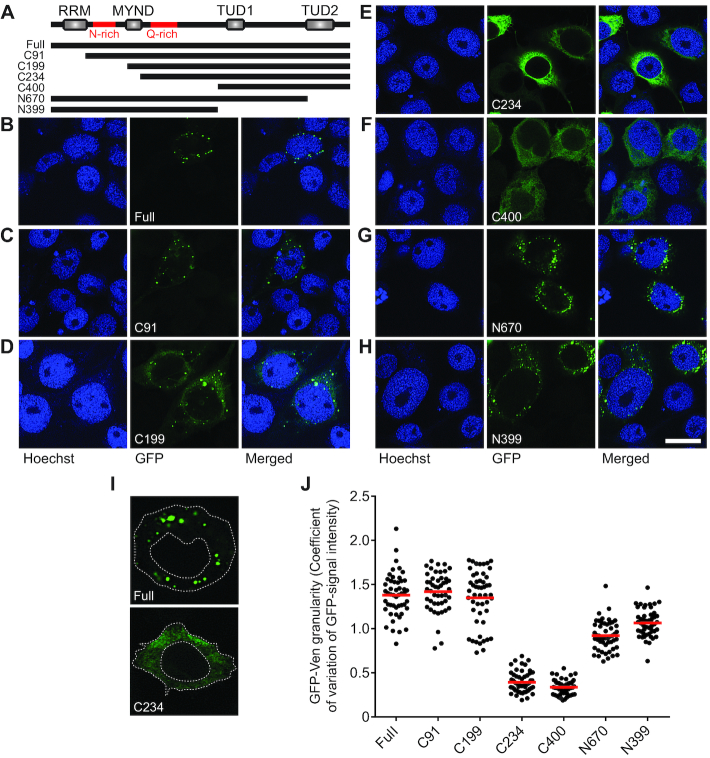
Veneno accumulates in cytoplasmic Ven-bodies. (A) Schematic representation of Ven transgenes used in IFA experiments. (Full: amino acid [aa] 1–785; C91: aa 91–785; C199: aa 199–785; C234: aa 234–785; C400: aa 400–785; N670: aa 1–670; N399: aa 1–399; red lines indicate sequences of low amino acid complexity, rich in asparagines [N] or glutamines [Q]). (B–H) Representative confocal images of Aag2 cells expressing transgenes drawn schematically in (A). Scale bar represents 10 μm. (I) The cytoplasm of 46–56 individual cells expressing GFP-tagged transgenes was traced as depicted and the mean and standard deviation of signal intensity was determined to calculate the coefficient of variation as a measure of signal granularity. (J) Scatter dot plot shows the GFP-signal granularity for individual cells; the red lines indicate the mean.

