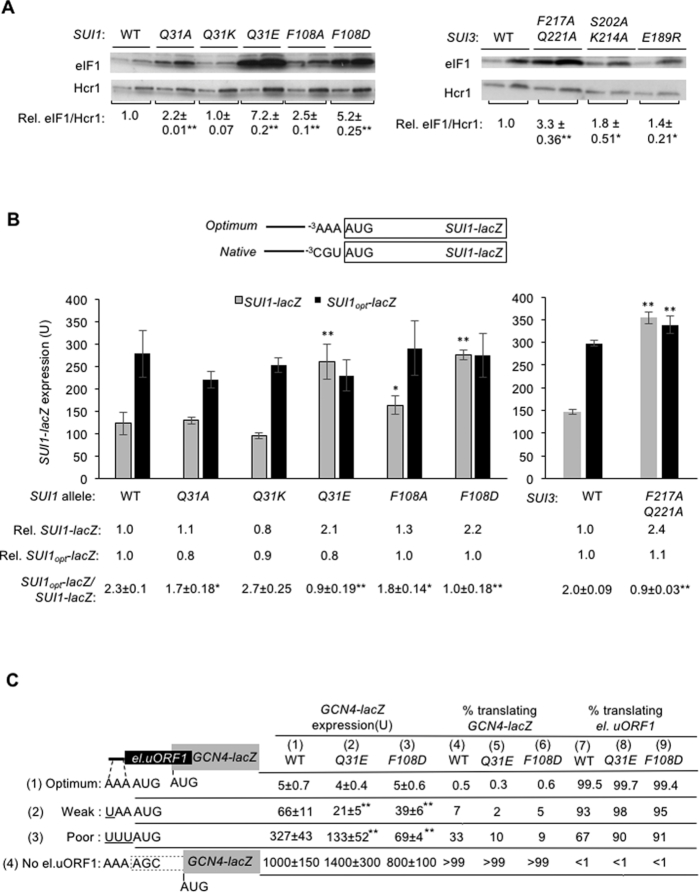
Figure 3.
Substitutions at the eIF2β:eIF1 interface of the open complex decrease discrimination against AUG codons in suboptimal contexts in vivo. (A) Derivatives of sui1Δ his4-301 strain JCY03 containing the indicated SUI1 alleles or derivatives of KAY18 containing the indicated SUI3 alleles were cultured in SD supplemented with His, Trp and Ura at 30°C to A600 of ∼1.0, and WCEs were subjected to western blot analysis using antibodies against eIF1 and Hcr1 (loading control). Two amounts of each extract differing by a factor of two were loaded in successive lanes. eIF1 western signals were normalized to those for Hcr1 and mean values (±SEM) were calculated from seven biological replicates. (B) The same strains as in (A) but harboring sc plasmids (pPMB24 or pPMB25) with SUI1-lacZ fusions with native suboptimal (-3CGU-1) or optimum (-3AAA-1) AUG contexts were cultured and assayed for β-galactosidase activities as in Figure 2B. Mean expression levels and SEMs were calculated from three transformants, and relative (Rel.) mean expression levels normalized to that of the WT strain are listed below, along with expression ratios for the SUI1-lacZ versus SUI1-opt-lacZ reporters. (C) Transformants of JCY03 harboring WT SUI1, sui1-Q31E or sui1-F108D and el.uORF1 GCN4-lacZ reporters (pC3502, pC3503 or pC4466) containing the depicted optimum (row 1), weak (row 2) or poor (row 3) context of uAUG-1, or an uORF-less GCN4-lacZ reporter with a mutated uAUG-1 (pC3505, row 4), were assayed for β-galactosidase activities as in Figure 2B. Mean expression values with SEMs were determined from six transformants (columns 1, 2 and 3). The percentages of scanning ribosomes that translate el.uORF1 (columns 7, 8 and 9) or leaky-scan uAUG-1 and translate GCN4-lacZ instead (columns 4, 5 and 6) were calculated from results in columns 1, 2 and 3 by comparing the amount of expression observed for each uORF-containing reporter to the uORF-less construct, as described in Supplementary Figure S2B and C. (A–C) Asterisks indicate significant differences between mutant and WT as judged by a two-tailed, unpaired Student's t-test (*P < 0.05; **P < 0.01).

