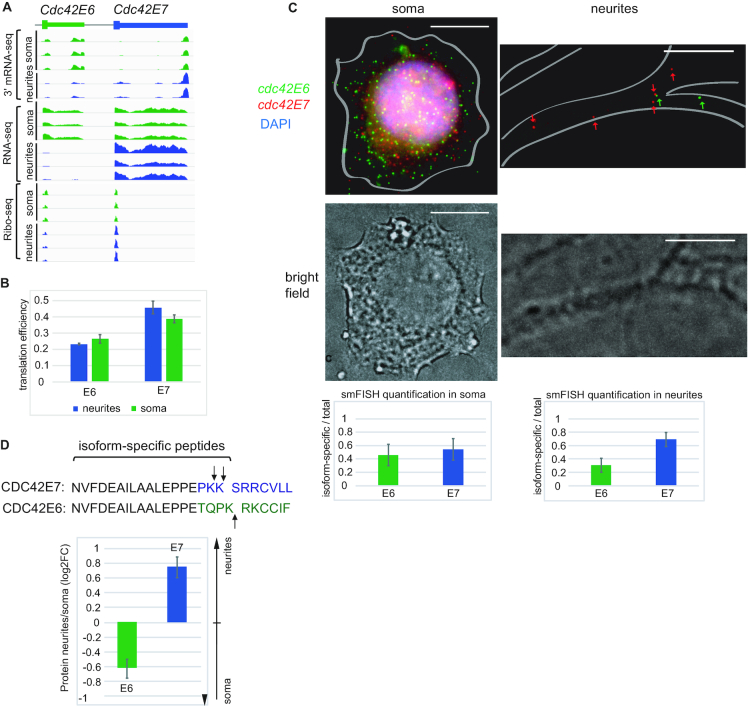
Figure 2.
Isoforms of the cell polarity gene Cdc42 are differentially localized between soma and neurites at mRNA and protein levels. (A) The snapshops from the genome browser showing distribution of Cdc42 sequencing reads (3′ mRNA-seq, total RNA-seq, Ribo-seq) between neurites and soma of mESC-derived neurons. Total RNA-seq and Ribo-seq data were reported in our previous work (7). (B) Translation efficiencies (TEs) of Cdc42 isoforms in neurites and soma. See Materials and Methods for details. Errors bars are SEM. Green bars: TE in soma, blue bars: TE in neurites. (C) smFISH of Cdc42E6 and Cdc42E7 transcripts with isoform-specific Stellaris probes was performed in mouse cortical neurons from P0 at DIV18 Cdc42E6: green (Q570), Cdc42E7: red (Q670), DAPI: blue, scale bar: 10 μm. Cell borders are outlined based on the brightfield image. Fluorescent spots corresponding to E6 and E7 isoforms were counted using StarSearch (Raj lab) and the quantification plots presented below the images (left: soma, right: neurites). The Y-axis shows ratios of isoform-specific to total Cdc42 signals in the analyzed subcellular compartment. The data represent averages of 13 neurons and the error bars are SD. (D) CDC42 protein isoforms are differentially distributed between neurites and soma. CDC42 isoform-specific peptides were extracted from the mass spectrometry data generated in our previous work (7) and used to evaluate relative levels of E6 and E7 isoforms in neurites and soma of mESC-derived neurons. The sequences show 25 C-terminal amino acids from which isoform-specific peptides are derived, with arrows pointing at the positions of trypsin digest. Values were normalized to the intensities of peptides shared between E6 and E7 isoforms. Error bars represent SD for 3 biological replicates.

