
FIGURE 4.
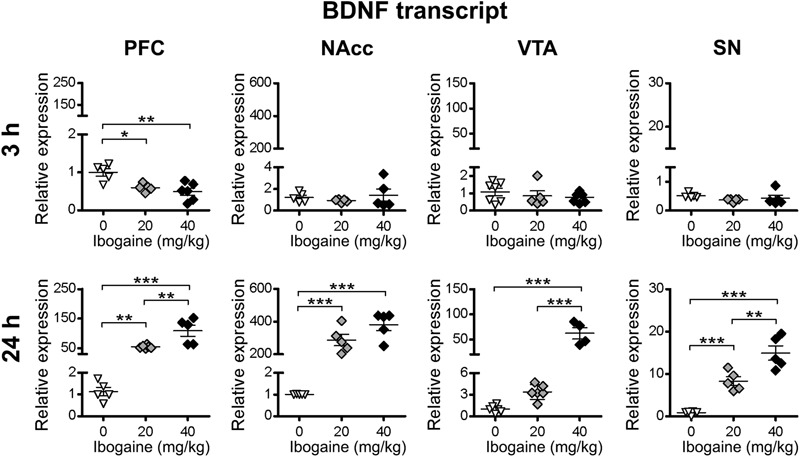
Effects of ibogaine administration on BDNF expression in specific brain areas. Quantitative analysis of BDNF transcript levels in the indicated brain areas after 3 h (upper panels) or 24 h (lower panels) of vehicle (0), 20 or 40 mg/kg ibogaine administration. For 3 h after treatment PFC, N = 16, P < 0.0001, F2,13 = 9.80, η2 = 0.61; For 24 h after treatment PFC, N = 16, P < 0.0001, F2,13 = 25.26, η2 = 0.80; For 24 h after treatment NAcc, N = 15, P < 0.0001, F2,12 = 46.62, η2 = 0.89; For 24 h after treatment VTA, N = 14, P < 0.0001, F2,11 = 46.46, η2 = 0.88; For 24 h after treatment SN, N = 16, P < 0.0001, F2,13 = 45.50, η2 = 0.88; ∗ P < 0.05, ∗∗ P < 0.01 and ∗∗∗P < 0.001 between indicated groups.