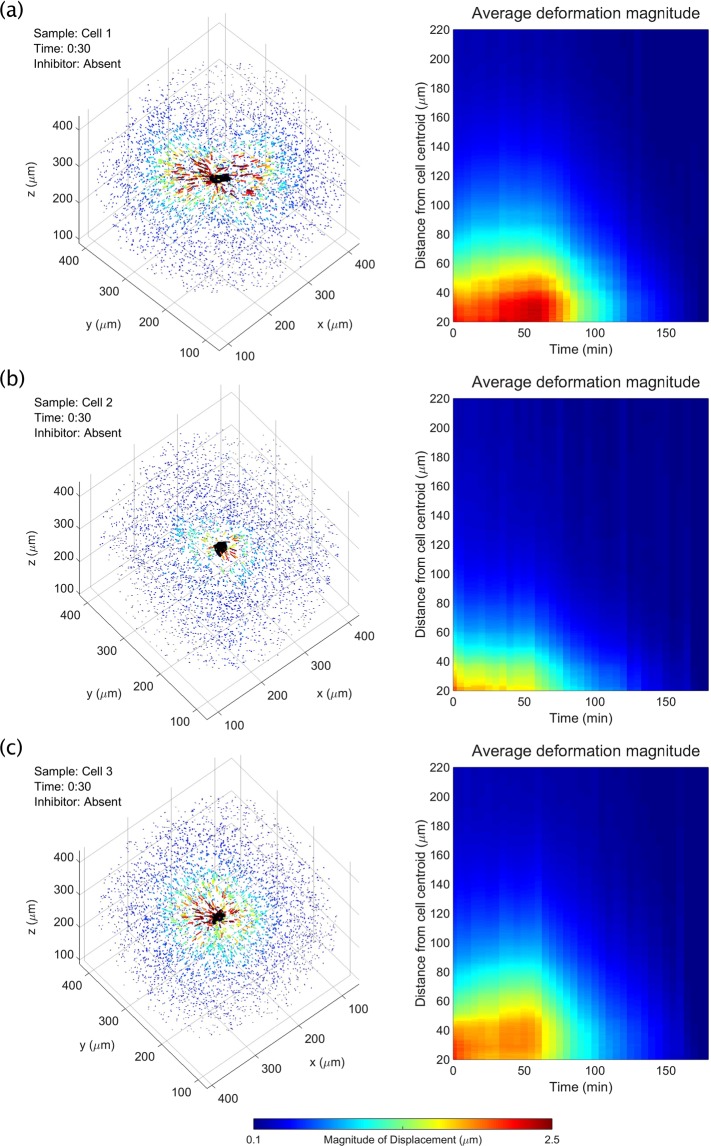
Figure 5.
Time-varying, 3D substrate deformations measured with TF-OCM. (a–c) Bead displacement data for three NIH-3T3 fibroblasts. Left panels depict bead displacements at the time point immediately preceding the addition of the contractility inhibitor, cytochalasin D. Arrows indicate bead displacements with respect to their ‘reference’ positions. Arrow lengths are exaggerated for visualization. Animations over time may be found in Supplementary Movie 2. Right panels depict the mean magnitude of bead displacement as a function of time and distance from the cell centroid (see the Supplementary Methods for details on this calculation). The bead localization sensitivity along the x, y, and z axes were 37 nm, 32 nm, and 86 nm, respectively (described in the Methods section).

