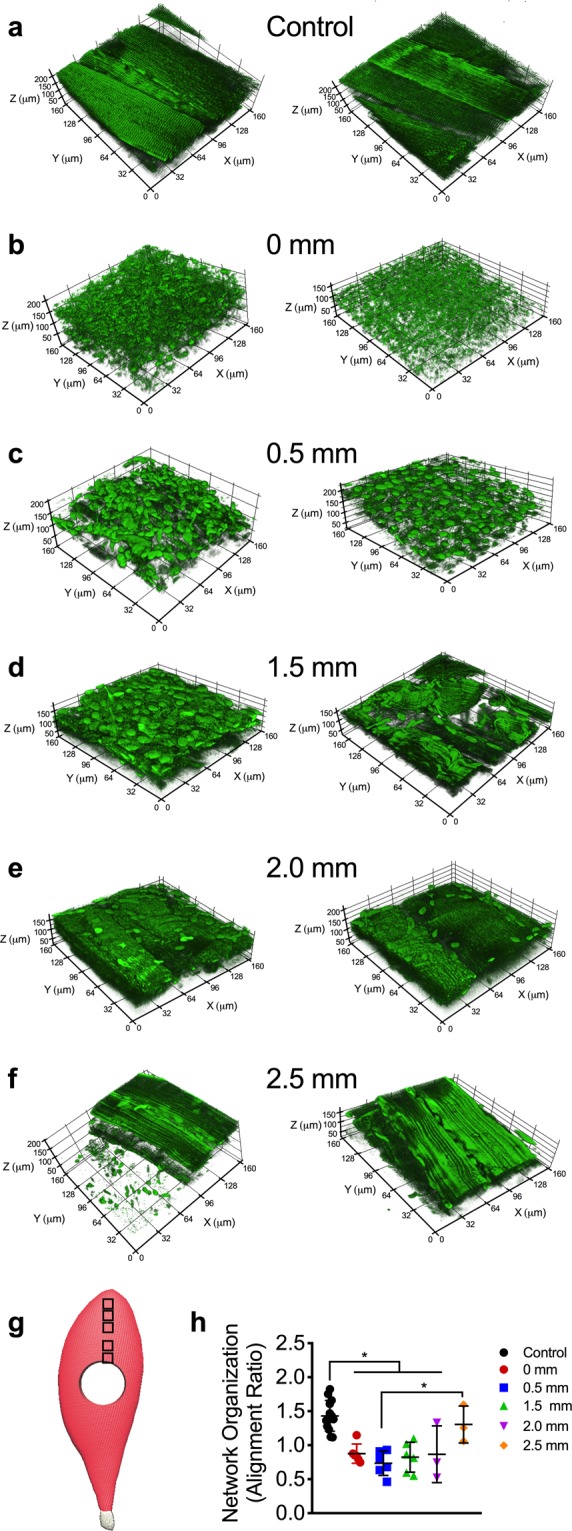
Figure 4.

Structural alterations in mitochondrial network extend well beyond the site of VML injury. The effects of VML on mitochondrial organization in control and muscle remaining 7 days after VML injury were evaluated at various distances from the injury site, two representative 3D reconstructions of mitochondrial networks are presented for each experimental condition. Representative images from (a) uninjured control and (b) 0 mm, (c) 0.5 mm, (d) 1.5 mm, (e) 2.0 mm, and (f) 2.5 mm away from proximal VML injury border. (g) Schematic showing an injured TA with boxes to indicating the imaging sites at increasing distances from the border of the VML injury toward the origin of the muscle. (h) Quantification of mitochondrial network organization (peak alignment/average alignment) at various distances from VML injury site (control n = 10, 0 mm; 0.5 mm, 1.5 mm n = 6; 2.0 mm, 2.5 mm n = 3 z-stacks per muscle). Data analyzed by one-way ANOVA, *P < 0.05. Error bars represent means ± SD.
