Figure 7.
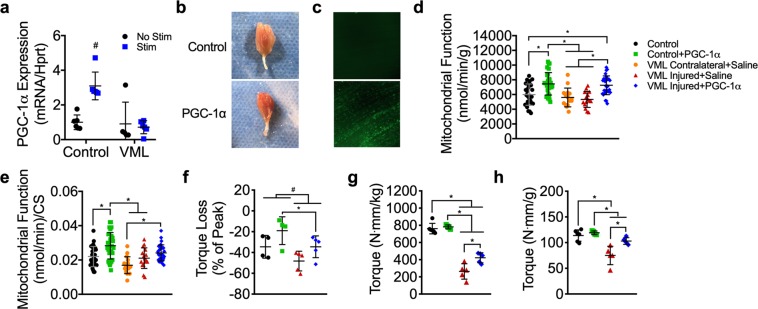
Effect of PGC-1α overexpression on oxidative capacity and plantarflexor muscle strength 4 weeks after VML injury. (a) PGC-1α gene expression 3 hours after completion of stimulation protocol (30 minutes of stimulation) for stimulated and non-stimulated limbs of control and VML injured mice; two-way ANOVA, interaction P < 0.001, # indicates significantly different from all other experimental groups. (b) Representative images of whole gastrocnemius muscles with (bottom) and without (top) PGC-1α overexpression showing increased red hue in PGC-1α transfected muscle, indicating greater oxidation. (c) Representative images of muscle with and without GFP-PGC-1α transfection showing GFP fluorescence in PGC-1α transfected muscle. (d) Mitochondrial respiratory function normalized by grams wet weight of permeabilized muscle fibers (n ≥ 15 permeabilized fiber bundles from n = 5 mice for each condition). (e) Mitochondrial respiratory function normalized to citrate synthase enzyme activity. (f) Plantarflexor torque loss following a fatiguing bout of 120 contractions; two-way ANOVA, P = 0.014 for both main effects of PGC-1α (*) and group (#). Peak isometric torque normalized to (g) body mass and (h) plantarflexor mass was partially rescued in the VML injured limb after PGC-1α overexpression. Data analyzed by one-way ANOVA unless specified otherwise, *P < 0.05. Throughout, error bars represent means ± SD.

