Figure 7.

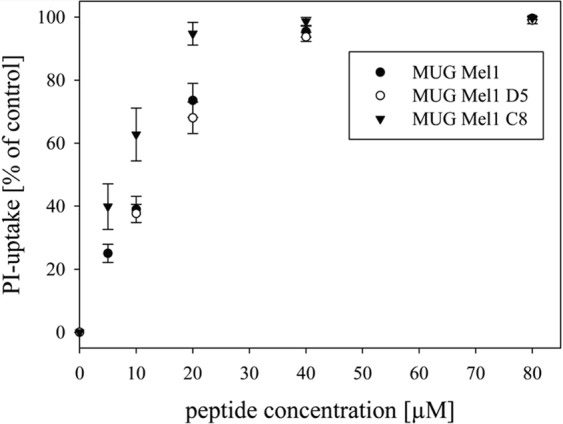
Peptide Treatment. The lines present cell death induced by increasing peptide concentrations determined by % PI-uptake of cell lines MUG-Mel1, D5, and C8 after 8 h of incubation. LC50 values are demonstrated in Table 1.

Peptide Treatment. The lines present cell death induced by increasing peptide concentrations determined by % PI-uptake of cell lines MUG-Mel1, D5, and C8 after 8 h of incubation. LC50 values are demonstrated in Table 1.