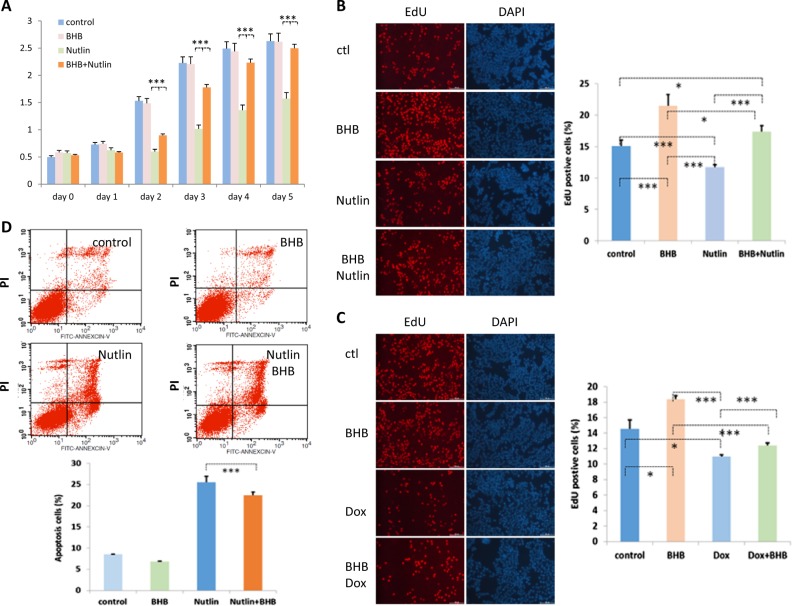
Fig. 4. p53 activity is attenuated in β-hydroxybutyrate-treated cells.
a Cell growth curve analysis of U2OS cells. A total of 3×10⁴ U2OS cells were seeded into six-well plates on day 1. The cells were left untreated, or treated with 10 mM BHB, 10 µM Nutlin, or both. Cell growth was monitored each day by staining the cells with 2% methylene blue in 50% ethanol for 15 min at room temperature. Stained cells were extracted with 1% SDS and the OD was measured at 640 nm. Data shown are averages + SEM. The p value was determined by paired Student’s t test (***p < 0.001). b U2OS cells were treated with 10 µM Nutlin for 8 h, 10 mM BHB for 16 h, or both. The treated cells were then grown in the presence of 50 µM EdU for 2 h, fixed and permeabilized. The proliferating cells were visualized using a Click-iT® EdU Apollo Fluor® 567 Imaging kit. The EdU-positive cells were counted under a microscope in 20 randomly chosen fields, and the percent was calculated. The experiments were carried out three times, and the averages of the data are presented. Cells were counterstained with DAPI. Data shown are averages + SEM. The p value was determined by paired Student’s t test (*p < 0.05, ***p < 0.001). c U2OS cells were treated with 10 mM BHB for 16 h, 10 µM doxorubicin for 8 h or both, and cell proliferation was measured as described in (b). Data shown are averages + SEM. The p value was determined by paired Student’s t test (*p < 0.05, ***p < 0.001). d FACS analysis of apoptosis in HCT116 cells treated with 10 µM Nutlin for 8 h, 10 mM BHB for 16 h or with both BHB and Nutlin. Apoptotic cells were stained with FITC-conjugated Annexin V and counterstained with propidium iodide. The cells were analyzed by FACS. Data shown are averages + SEM. The p value was determined by paired Student’s t test (***p < 0.001)

