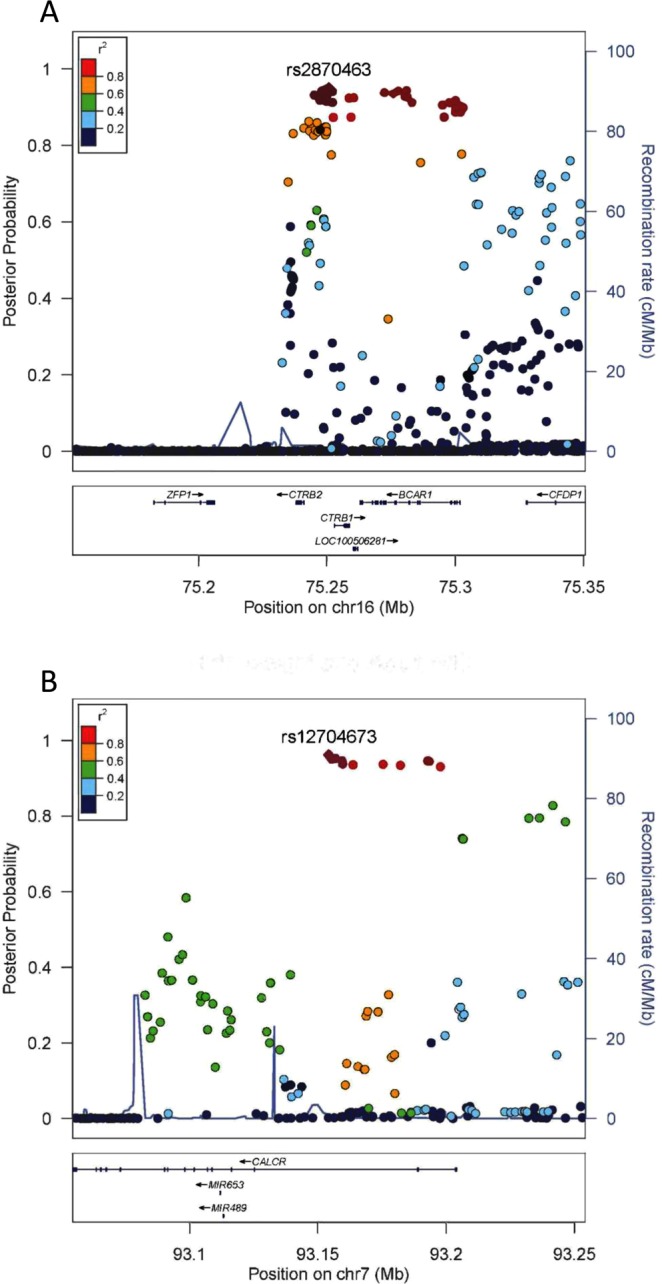
Figure 2.

Regional plots of loci associated with birthweight and cardiometabolic disease traits in later life. Data span 200 kb centered at the index SNP. The x-axis denotes genomic position and the y axis denotes the posterior probability of association, and recombination rate (cM/Mb). The purple circle point represents the index SNP. The color of each data point indicates its linkage disequilibrium value (r2) with the index SNP based on HapMap2. (A) Regional association plot for a locus in CTRB1 associated with birthweight and coronary artery disease. (B) Regional association plot for a locus in CALCR associated with birthweight and waist circumference.
