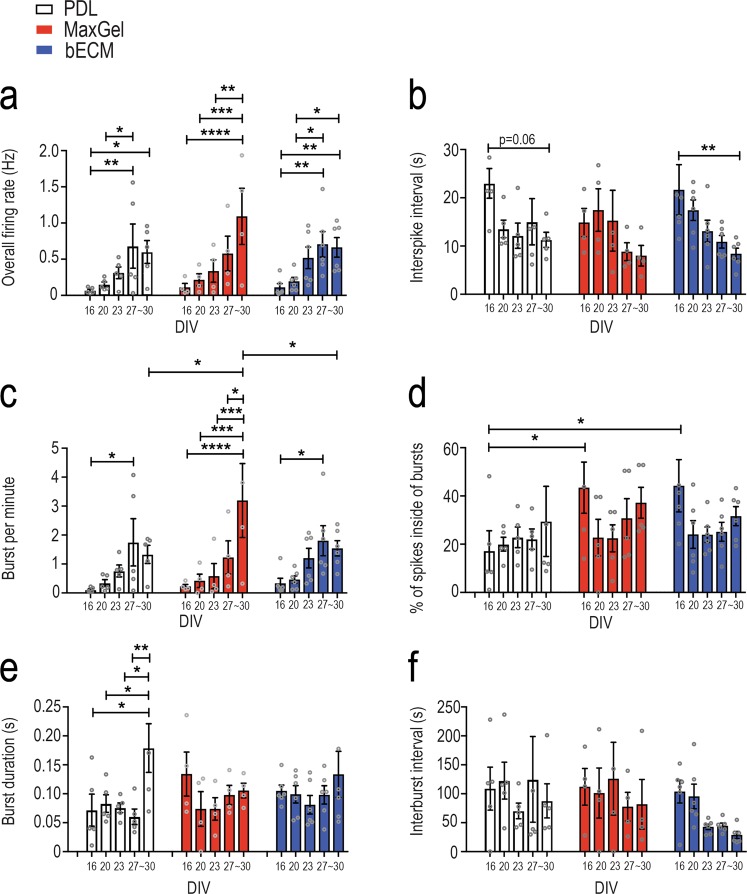
Figure 3.
Features of neural network activity for co-cultures grown in the presence and absence of an ECM coating. Bar graph summarizes each electrophysiology feature across a period of ~30 DIV for each experimental condition: PDL (white), MaxGel (red), and bECM (blue). Features of neural activity include: overall firing rate (a), interspike interval (b), burst per minute (c), percentage of spikes inside of bursts (d), burst duration (e) and interburst interval (f). Individual data points are represented as open circles, and summary data bars are presented as mean ± SEM for the number of devices in PDL (n = 5), MaxGel (n = 4) and bECM (n = 6). Data were analyzed using repeated measures two-way ANOVA with Tukey’s post hoc test. Statistical significances are at a level of *p < 0.05, **p < 0.01, ***p < 0.001, and ****p < 0.0001.

