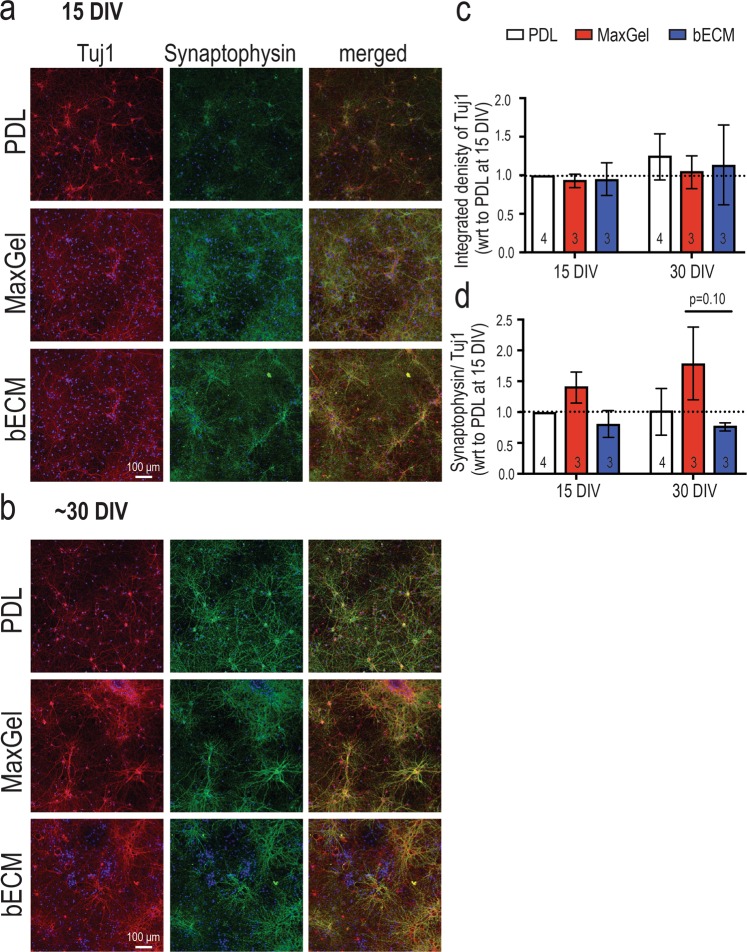
Figure 5.
Synaptophysin expression in Tuj1-positive cells grown in the presence and absence of an ECM coating. Representative fluorescent images showing Tuj1-positive neurons (red) and synaptophysin expression (green) at 15 DIV (a) and 30 DIV (b). Scale bar = 100 μm. Bar graphs summarize the integrated density of Tuj1 (c) and synaptophysin normalized to Tuj1 (d) per field of view. Data are expressed as a fold change relative to PDL group at 15 DIV, as shown by the dash line, presented as mean ± SEM for the number of cultures indicated at the base of each bar (n = 3–4 biological repeats), and were analyzed using two-way ANOVA with Tukey’s post hoc test.

