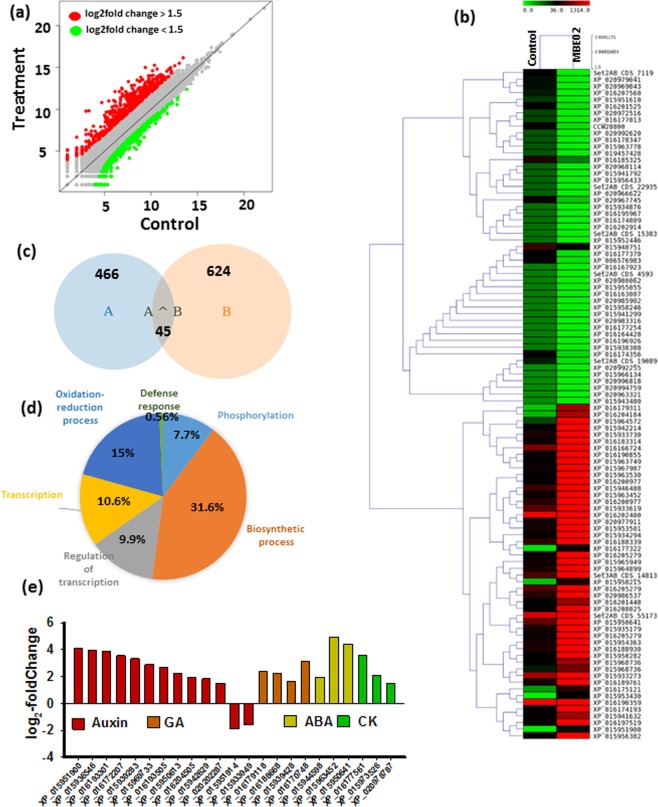
Figure 2.
Effect of MBE02 on gene expression in peanut. (a) Scatter plot of differentially expressed genes between MBE02 treated roots and untreated control. 12 d old peanut plants were inoculated with MBE02 (106 cells/ml) and root samples were collected after 14 days. Roots of 8-10 plants were combined for each samples. (b) Heat map of top 100 (50 each for up- and - down regulated) differentially expressed genes in peanut roots after MBE02 inoculation as compared to non-inoculated roots. (c) Venn diagram shows number of differentially expressed genes contributed by A (A. duranensis), B (A. ipaensis) and both (A + B) the progenitor genomes in MBE02 treated peanut. (d) Go enrichment analysis (biological category) of differentially expressed genes. (e) Genes involved in hormone signaling that were activated after MBE02-inculation than the control.

