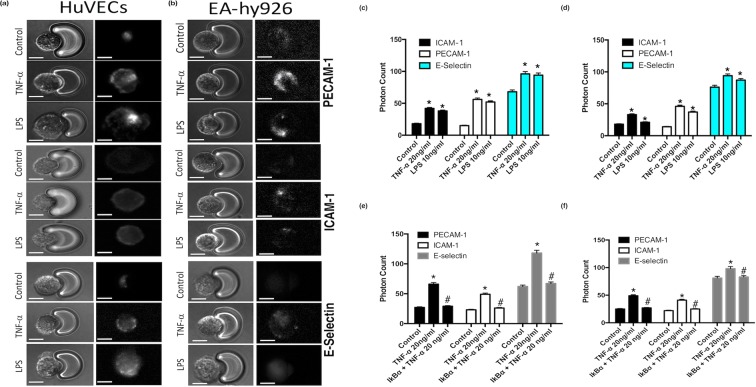
Figure 3.
Immunocytochemical analysis of individual cells captured on the LoaD platform. (a,b) Representative immunocytochemical analysis of PECAM-1, ICAM-1 and E-selectin expression in individual HUVECs and EA.hy296 cells following treatment of cells with or without TNF-α (20 ng/ml) or LPS (10 ng/ml) for 24 hours. Bright field images and corresponding fluorescent images taken at 20x magnification with uniform region of interest selection for each image. (c,d) Cumulative analysis of the photonic fluorescence counts for PECAM-1, E-selectin and ICAM-1 following treatment with TNF-α and LPS, respectively. (e,f) Inhibition of TNF-α induced endothelial activation of PECAM-1 ICAM-1 and E-selectin in individual HUVECs and EA.hy296 cells, respectively, following NFκB inhibition with IκBα. (N = 3, *p = 0.035 #p = 0.04 HUVECs, *p = 0.045 #p = 0.04 EA.hy926 cells, n = 120 cells).

