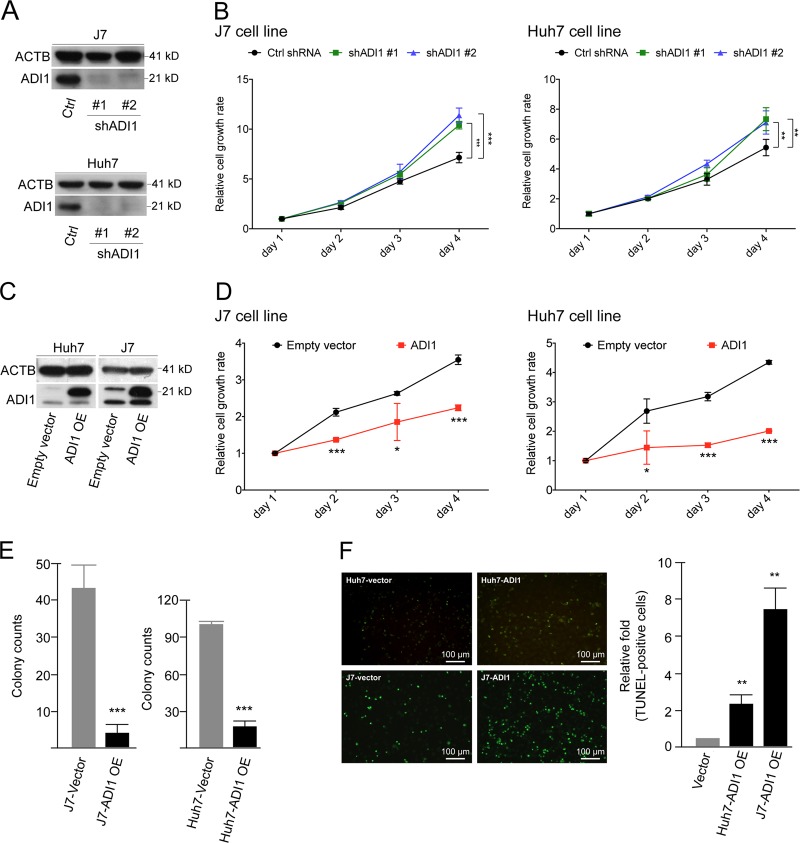
Fig. 2. ADI1 suppressed hepatocellular carcinoma (HCC) cell proliferation.
a A representative western blot analysis of samples derived from stably ADI1-knockdown in J7 (upper) and Huh7 (lower) cells. Two targets (#1 and #2) for shADI1-mediated knockdown were performed. b The proliferation rates were determined by measuring the florescence of metabolite derived from alarmar blue in J7 (left) or Huh7 (right) cells. Black, mock control (Ctrl); green, shADI1#1 knockdown; blue, shADI1#2 knockdown. c Western blots of ADI1 overexpressing (OE) in Huh7 or J7 cells. d Proliferation rates of mock (empty vector, black) or ADI1-overexpressing cells (red) on days 1–4 post seeded to a 96-well plate. e Colony formation assay of ADI1 overexpressing (OE) in J7 (left) and Huh7 (right) cells. f The representative image of apoptosis status in Huh7 and J7 cells with or without ADI1 overexpression (OE). The p values were derived by using unpaired two-tailed Student's t-test. **p < 0.01. The white line represented the scale bar as indicated. The short vertical bars represented standard deviations

