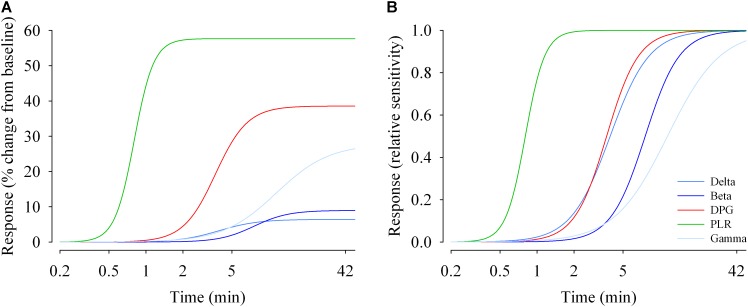
FIGURE 6.
Duration response curves of non-visual functions in humans. The response magnitudes were plotted against duration of light exposure and fitted with a 4-parameter logistic model. (A) Response change (% change from baseline dim light) during light exposure differed between functions. The maximal responses vary between ∼6% (EEG delta activity) and ∼60% for the pupillary light reflex (PLR; tonic pupil response). (B) Relative responses reveal that sensitivity differs between non-visual functions. EC50s (half-maximum values) range between ∼48 s (tonic pupil response) and ∼12 min (EEG gamma activity). Parameter estimates and R2 values are given in Supplementary Table 5.

