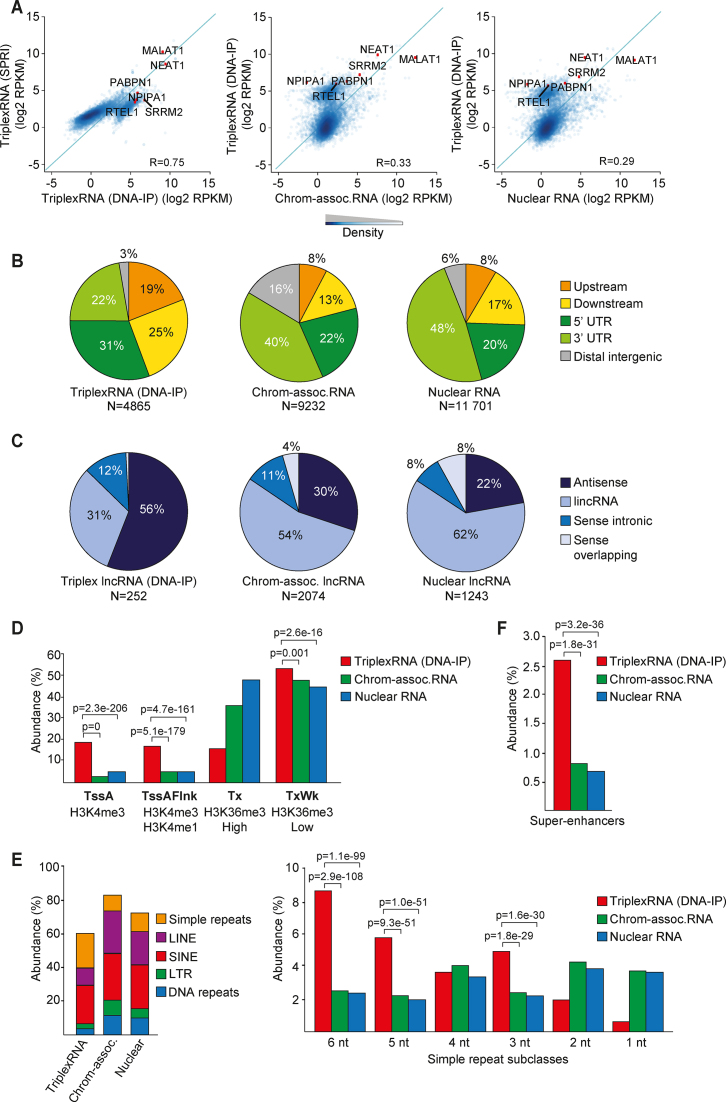
Figure 2.
Identification and global characterization of DNA-associated RNA. (A) Scatter plots showing the correlation between TriplexRNA isolated by DNA-IP and SPRI selection (left) and TriplexRNA (DNA-IP) and control RNA (middle, right). Pearson correlation coefficient (R) across 7148 genes overlapping peaks is shown. Green diagonal line x = y. Some representative genes that overlap TriplexRNAs and control RNAs are highlighted. (B) Pie charts depicting the genomic distribution of TriplexRNA (DNA-IP) compared to chromatin-associated and nuclear RNA peaks, excluding intronic and exonic gene regions. Upstream and downstream regions are defined within 2.5 kb proximity of the closest gene. (C) Pie chart showing classification of long noncoding RNAs that overlap TriplexRNA (DNA-IP), chromatin-associated and nuclear RNA. (D) Association of TriplexRNA (DNA-IP) and control RNA with ChromHMM promoter states and transcribed states. Active transcription start site (TssA), flanking active TSS (TssAFlnk), strong (Tx) and weak (TxWk) transcription regions are shown. (E) Left: Overlap of TriplexRNA (DNA-IP), chromatin-associated RNA and nuclear RNA with different classes of repeat elements. Right: Abundance of simple repeat subclasses. (F) Abundance of TriplexRNA (DNA-IP) and control RNAs overlapping super-enhancers in HeLa S3 cells. Data are from HeLa S3 cells. Adjusted P-values <0.05 in panels (D–F) were obtained from one-tailed Fisher's exact test using chromatin-associated and nuclear RNA as control.

