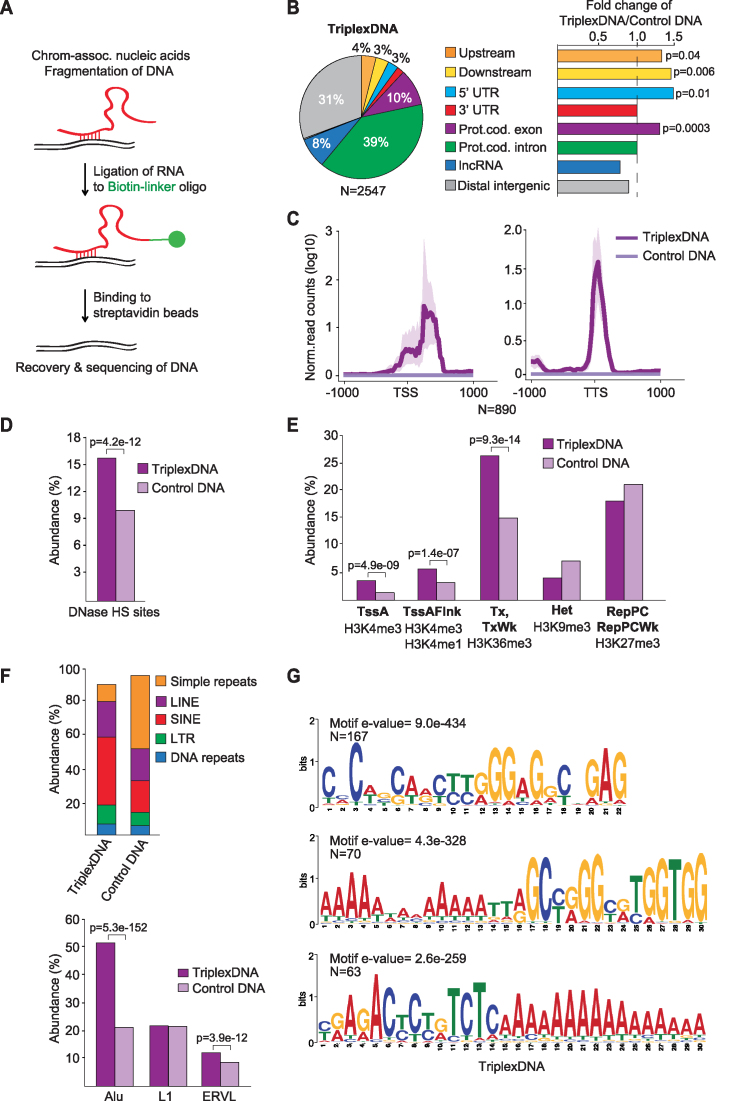
Figure 3.
Isolation and identification of RNA-associated DNAs. (A) Scheme illustrating the method used to isolate RNA-associated DNA (TriplexDNA). (B) Pie chart depicting the genomic distribution of TriplexDNA peaks. Upstream and downstream regions are defined within 2.5 kb proximity of the closest gene. The bar diagrams at the right display the fold change in the distribution of the respective regions in TriplexDNA compared to control DNA. (C) Line plots depicting the mean values of TriplexDNA-seq signals over TSS and TTS of 890 genes that overlap RNA-associated DNA peaks. Interval defined by maximum and minimum values is shaded. (D) TriplexDNA-seq regions overlapping DNase Hypersensitive Sites (DNase HS) in HeLa S3 cells provided by ENCODE. (E) Abundance of TriplexDNA regions associated with the indicated ChromHMM states. Active transcription start site (TssA), flanking active TSS (TssAFlnk), strong and weak (Tx, TxWk) transcription, heterochromatin (Het) and Polycomb-repressed (RepPC) regions are shown. (F) Top: Overlap of TriplexDNA and control DNA with different classes of repeat elements. Bottom: Abundance of predominating repeat subclasses in TriplexDNA. (G) MEME motif analysis identifying purine-rich consensus motifs in randomly selected 500 TriplexDNA peaks. Data are from HeLa S3 cells. Adjusted P-values <0.05 reported in panels (B,D-F) were obtained from one-tailed Fisher's exact test.

