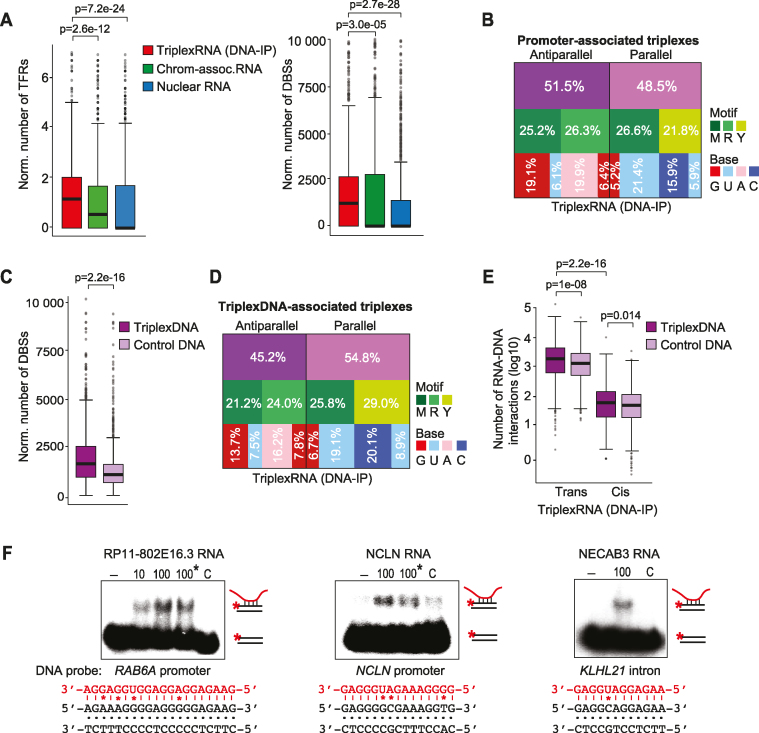
Figure 4.
Validation of triplex-forming RNA and DNAs. (A) TDF analysis predicting the potential of top 1000 enriched TriplexRNA (DNA-IP) regions (ranked by peak P-value) to bind to active promoters defined by ChromHMM. Number of TFRs in RNA (per kilobase of RNA, left) and the number of putative DBSs at promoters (per kilobase of RNA, right) are shown. Boxplot borders are defined by the 1st and 3rd quantiles of the distributions, the middle line corresponds to the median value. The top whisker denotes the maximum value within the third quartile plus 1.5 times the interquartile range (bottom whisker is defined analogously). Dark gray dots represent outliers with values higher or lower than whiskers. Further box plots are based on the same definitions. (B) Motif analysis of triplexes formed between TriplexRNA (DNA-IP) and active promoters. The diagram depicts the fraction of antiparallel and parallel triplexes with the respective motif and nucleotide composition of TFRs in TriplexRNA. (C) TDF analysis comparing the triplex-forming potential of top 2000 TriplexDNA-seq regions with top 1000 TriplexRNA (DNA-IP) (ranked by peak P-value). The number of putative DBSs (per kilobase of RNA) is shown. (D) Motif analysis of predicted triplexes formed between TriplexRNAs (DNA-IP) and TriplexDNA. The diagram depicts the fraction of antiparallel and parallel triplexes, with the respective motif and nucleotide composition of TFRs in TriplexRNA. (E) Box plot classifying triplex interactions between TriplexRNAs (DNA-IP) and TriplexDNA-seq regions as cis (>10 kb in the same chromosome) and trans (at different chromosomes) interactions, excluding underrepresented local interactions (within 10 kb distance). (F) EMSAs using 10 or 100 pmol of synthetic TriplexRNAs and 0.25 pmol of double–stranded 32P-labeled oligonucleotides comprising target regions from TriplexDNA (Supplementary Table S2). Reactions marked with an asterisk (*) were treated with 0.5 U RNase H. As a control (C), RNA without a putative TFR was used. Potential Hoogsteen base pairing between motifs and respective TFR sequences are shown; mismatches are marked (*). TriplexRNA-seq and TriplexDNA-seq data are from HeLa S3 cells. Adjusted P-values <0.05 in panels (A, C, E) are based on one-tailed Mann–Whitney test.

