Figure 5.
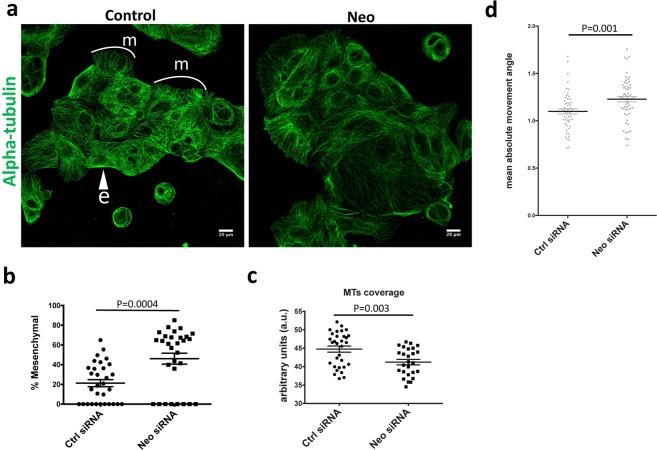
Phenotypic characterization of Neo1-depleted Caco-2 epithelial islands. (a) Immunostaining of control and Neo1-siRNA treated Caco-2 epithelial islands with alpha-tubulin (green). A proportion of cells around the periphery of islands exhibited a spread, migratory morphology in which microtubule arrays were oriented away from the island. These were categorized as “mesenchymal” (m). Loss of Neo1 resulted in a higher proportion of mesenchymal cells and decreased microtubule density. (b) Quantification of the proportion of mesenchymal cells per island, p-value = 0.0004. (c) Quantification of mean MT density in control and Neo1-depleted cells (see Materials and Methods for details), p-value = 0.003. (d) Kymograph analysis of Neo1-knockdown Caco-2 cells revealed an increase in the angle of movement of internal cellular features, p-value = 0.001.

