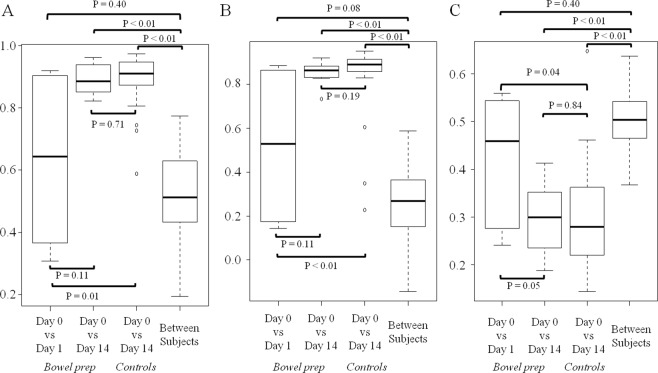
Figure 2.
Gut microbial composition across different sampling times in the bowel prep group vs control group. (A) Spearman’s correlation coefficients of gut microbial composition at the genus level. (B) Spearman’s correlation coefficients of gut microbial composition at the species level. (C) Weighted UniFrac distances of gut microbial composition. Note: Boxes represent the interquartile range (IQR) and lines inside show the median. Whiskers denote the lowest and highest values within 1.5 times the IQR.

