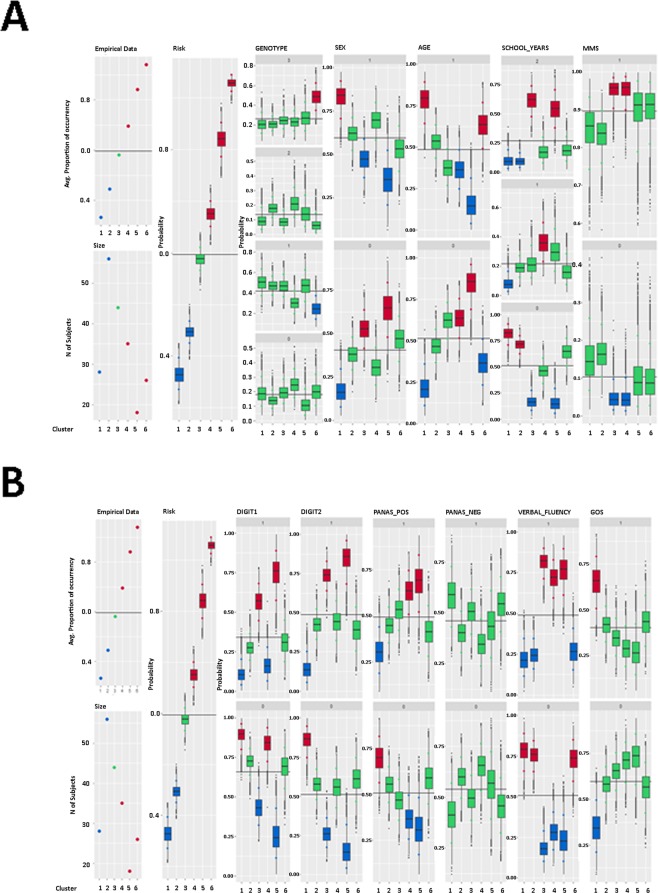
Figure 3.
Total number of words remembered as response variable: summary plot of the posterior distribution of parameter ϕc, for c = 1, …, 6. Panel A shows the posterior distributions of the probability that a chosen covariate is equal to a given discrete category, across the identified clusters. In the coding of the ordinal categories, 0 corresponds to the lowest category and 1 to the highest. Finally, the box-plots are coloured according to the significance of the posterior estimates. red-coloured boxes indicate a performance above the average, green-coloured boxes indicate average performance, and blue-coloured boxes indicate a performance below average.

