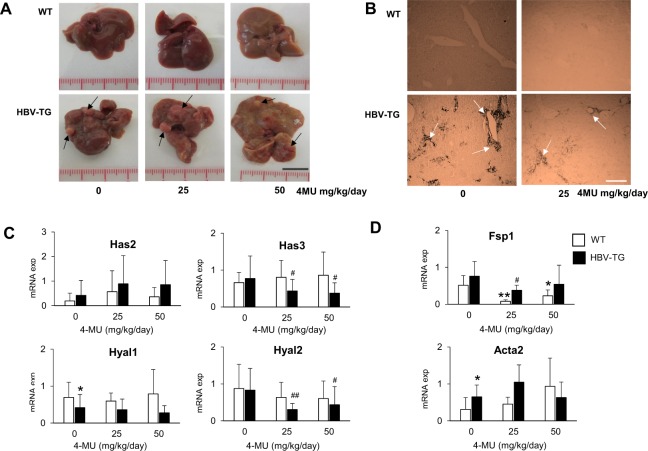
Figure 1.
Effect of 4MU treatment in HBV-TG mice. (A) Macroscopic appearance of liver after 12 weeks treatment of 25 and 50 mg/kg/day 4MU (scale bar = 1 cm). (B) HA staining of the liver before and after treatment. Magnification: 200X (scale bar = 300 µm). (C) Relative mRNA expressions of hyaluronan synthases Has2 and Has3, and hyaluronidases Hyal1 and Hyal2. (D) Relative mRNA expressions of fibrosis and ECM genes Fsp1 and Acta2. Each mRNA expression of target genes was normalized to reference genes Gapdh and Actb. Statistical analysis: *p < 0.05, **p < 0.01 compared to WT 0 mg/kg/day, #p < 0.05, ##p < 0.01 compared to TG 0 mg/kg/day. WT = wild type mice, HBV-TG = HBV-transgenic mice.

