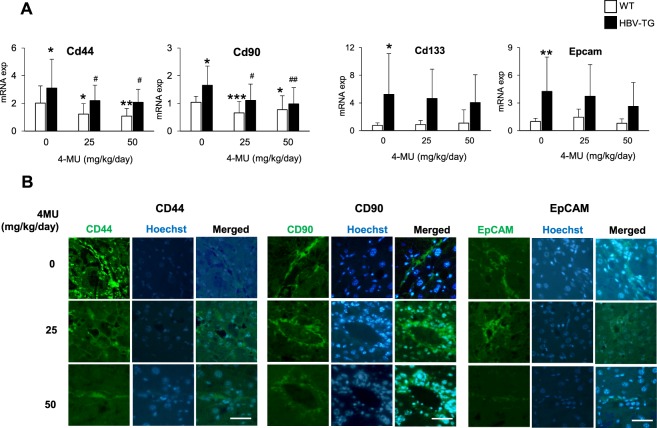
Figure 4.
4MU treatment reduces the expressions of CSC markers in mouse model. (A) Relative mRNA expressions of CSC markers Cd44, Cd90, Cd133, and Epcam in HBV-TG and WT mice. Statistical analysis: *p < 0.05, **p < 0.01 compared to WT 0 mg/kg/day, #p < 0.05, ##p < 0.01 compared to TG 0 mg/kg/day. (B) Representative of immunofluorescence images of protein CD44, CD90, and EpCAM in HBV-TG (scale bar = 50 µm). WT = wild type mice, HBV-TG = HBV-transgenic mice.

