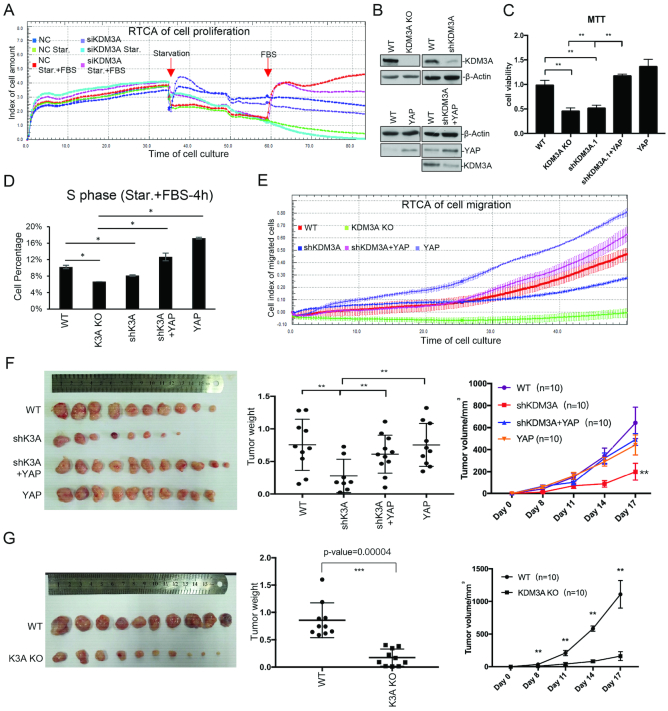
Figure 6.
KDM3A promotes colon cancer cell proliferation and migration through hippo pathway. (A) KDM3A was knocked down HCT116 via siRNA and cells were seeded at a density of 4000 cells/well in xCELLigence plates. Cell index (cell proliferation) was monitored with RTCA as the manufacturer's protocol. Cells were serum starved 36 h after plating and FBS was added 24 h later. The impedance signals were recorded every 15 min over a period of up to 80 h. (B) Western analysis of wild type, shKDM3A, KDM3A KO, YAP1 overexpression and shKDM3A with YAP1 overexpression stable cell lines. (C) MTT assay to show cell proliferation of the cell lines in (B). (D) The above cell lines were starved and treated with FBS. BrdU and PI were used to label cells before cell percentage was assayed with flow cytometry. The percentage of S phase was shown. (E) Cell migration of the above cell lines was assayed with RTCA according to the manufacturer's protocol. (F, G) The above cell lines were injected into nude mice (n = 10). The image of tumors (left), tumor weight (middle) and tumor growth curve (right) were shown. (G) The KDM3A knockout and control cell lines were injected into nude mice (n = 10). The image of tumors (left), tumor weight (middle) and tumor growth curve (right) were shown. * means P-value ≤ 0.05, ** for P-value ≤ 0.01 and *** for P-value ≤ 0.001.

