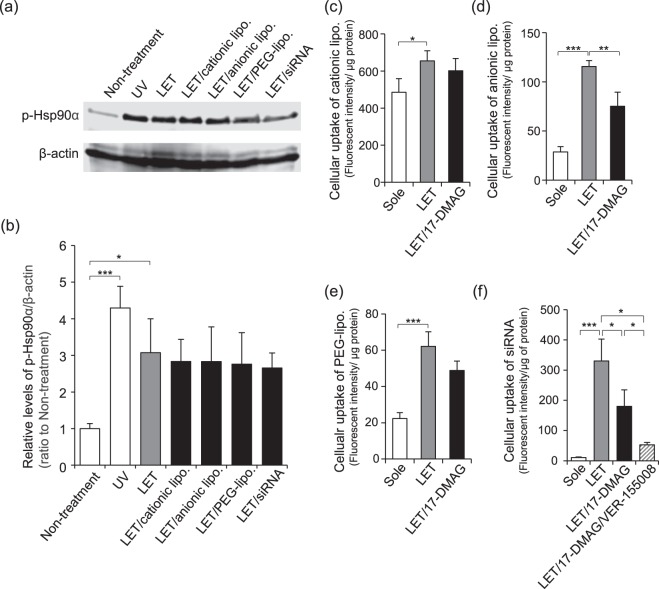
Figure 2.
Activation of Hsp90α and cellular uptake of macromolecules by LET. (a,b) NIH 3T3 cells were treated with LET in presence of cationic lipo, anionic lipo, PEG-lipo or siRNA. Hsp90α (Thr5/7) levels were determined by western blotting. β-actin was used as a loading control. Samples from UV-exposed cells were used as a positive control. (a) Typical images from at least 3 individual experiments. Full-length blots/gels are shown in Supplementary Fig. S1. (b) Relative levels of p-Hsp90α/β-actin. Data are shown as the ratio to untreated cells. (c–e) Cells were pretreated for 1 h with 10 μM 17-DMAG prior to LET in the presence of cationic lipo (c), anionic lipo (d), or PEG-lipo (e). (f) Cells were pretreated with 10 μM 17-DMAG or 10 μM 17-DMAG with 50 μM VER-155008 for 1 h prior to LET in the presence of siRNA. (c–f) After incubation for 45 min, the cells were lysed, and the fluorescence intensity of the lysate was measured to evaluate cellular uptake of macromolecules. Data are shown as the fluorescence intensity divided by protein amount. Values represent the means of 3 individual experiments. Bars represent standard deviations. *P < 0.05, **P < 0.01 and ***P < 0.001.

