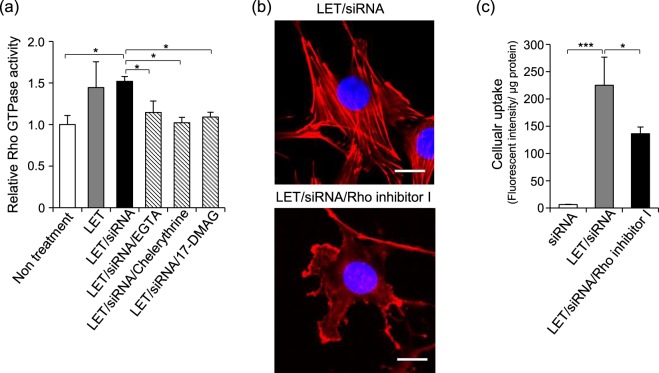
Figure 5.
Activation of Rho GTPase by LET with siRNA. (a) Relative Rho GTPase activity. After 36 h of serum starvation, cells were treated with LET in presence of siRNA, and were lysed immediately after LET. Rho GTPase activity in the lysate was measured by G-Lisa activation assay (Cytoskeleton Inc.). (b,c) Cells pretreated with Rho inhibitor I for 4 h, followed by LET in presence of siRNA. (b) Effect of Rho inhibitor I on actin cytoskeleton remodeling induced by LET with siRNA. Red and blue signals indicate rhodamine phalloidin-labelled actin and nuclei, respectively. Scale bars indicate 20 μm. (c) The effect of Rho inhibitor I on LET-mediated cellular uptake of siRNA. Values represent the means of 3 individual experiments. Bars represent standard deviations. *P < 0.05 and ***P < 0.001.

