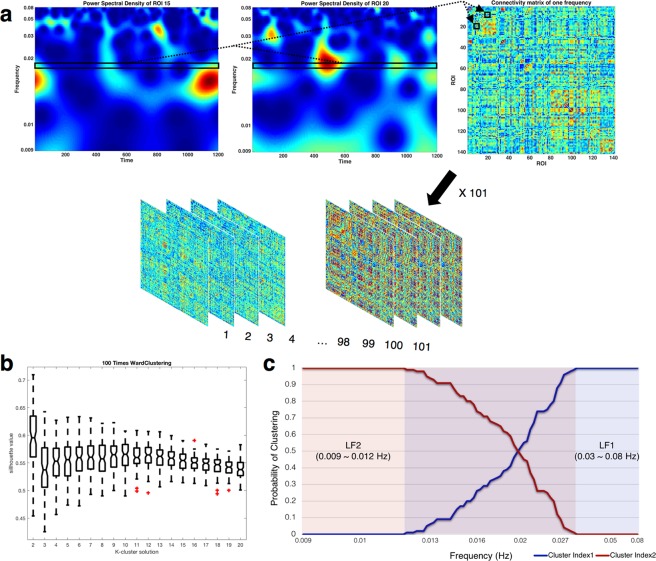
Figure 1.
Construction of the connectivity matrix and division frequency bands. (a) A connectivity matrix was constructed for each frequency bin by using Pearson’s correlation coefficient of each power spectral density (PSD) time-course through all nodes. The black rectangular small box indicates PSD time-course of specific frequencies. A 141 × 141 connectivity matrix of specific frequencies with a total of 101 frequency bins is presented. (b) The hierarchical clustering between group averaged connectivity matrices of each frequency was calculated by using Jensen Shannon divergence. For the highest silhouette value, 101 frequency matrices were clustered into 2 subbands. (c) Probability of clustering index for each frequency bin. Since the probability of the intermediate frequency band is uncertain, only the frequency bands at both ends were defined as the final 2 subbands (LF1: 0.03–0.08 Hz, LF2: 0.009–0.012 Hz).

