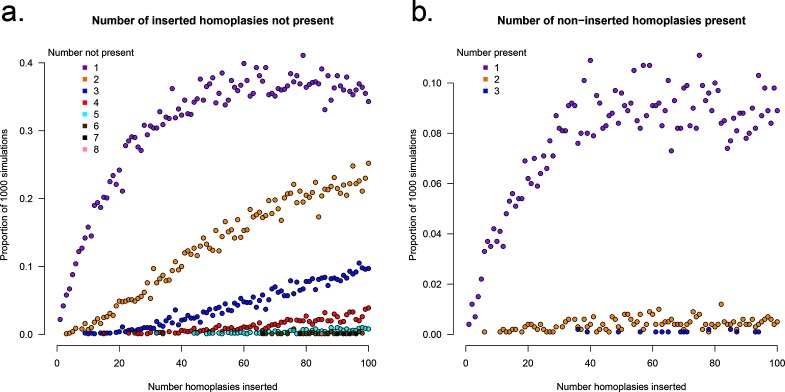
Fig. 2.
Identifying homoplasies in simulated data using HomoplasyFinder. (a) The proportion of 1000 simulated phylogenetic datasets with X inserted homoplasies (where the number of inserted homoplasies ranged from 0 to 100 in steps of 1) not identified using HomoplasyFinder - i.e., false negatives. (b) The proportion of 1000 simulated phylogenetic datasets with X non-inserted homoplasies identified by HomoplasyFinder - i.e., false positives. Each point is coloured according to X, which represents either the number of inserted homoplasies not found, or the number of non-inserted homoplasies found.

