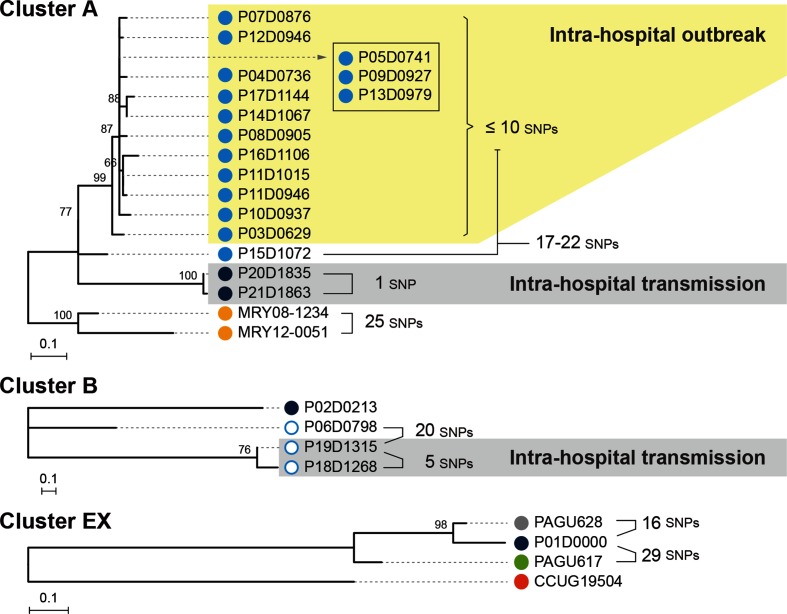
Fig. 3.
Phylogenetic analyses of the three clusters identified in the first-step analysis. The three clusters identified in the first-step analysis were separately analysed. SNPs were identified in each cluster using the complete genome sequences of MRY08-1234 (cluster A), P06D0798 (cluster B) and P01D0000 (cluster EX) as references for each cluster to reconstruct ML trees using RAxML-NG with the TPM2 (cluster A) or K80 (clusters B and EX) models. The trees are shown by mid-point rooting. Bootstrap values based on 1000 bootstrap replicates are indicated at nodes. Pairwise SNP distances between isolates are also indicated. The colours of each dot correspond to the strain information indicated in Fig. 2.

