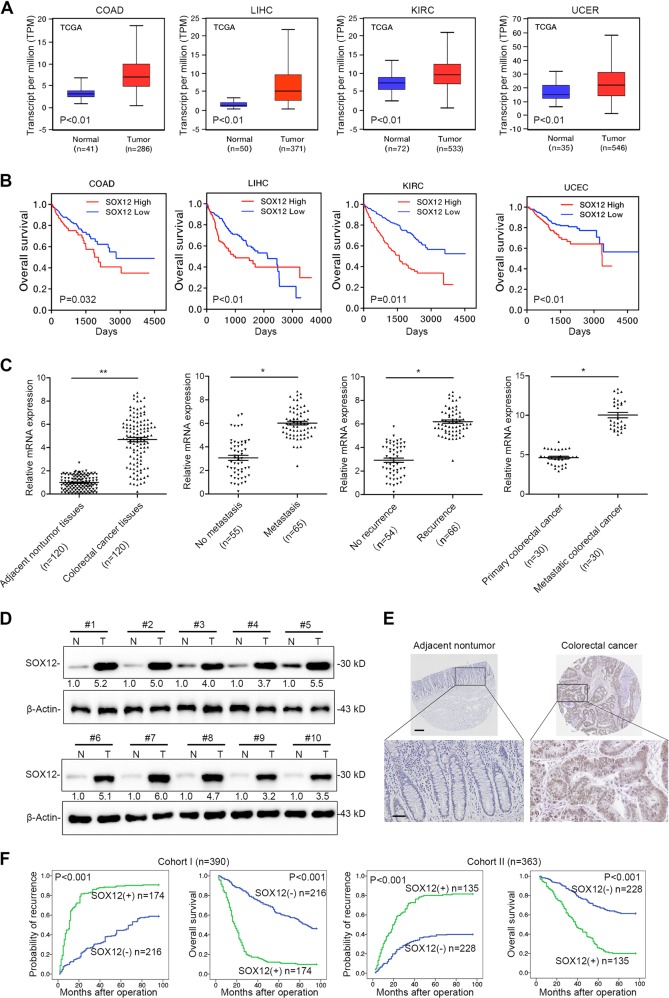
Fig. 1. Elevated expression of SOX12 indicates a poor prognosis in patients with CRC.
a Representative data extracted from TCGA datasets showing the relative expression of SOX12 mRNA in multiple cancer tissues compared with normal tissues. The box-and-whisker plots show the medians (horizontal lines), interquartile ranges (boxes), and minimum and maximum values (whiskers) of the data. COAD colon adenocarcinoma, KIRC kidney renal clear cell carcinoma, LIHC liver hepatocellular carcinoma, UCEC uterine corpus endometrial carcinoma; **P < 0.01 and *P < 0.05. b Kaplan–Meier analysis showing the correlation between SOX12 mRNA expression and OS for the patients included in the TCGA datasets. c RT-PCR analysis showing the pattern of SOX12 expression in human CRC tissues compared with adjacent nontumor tissues, metastatic CRC compared with nonmetastatic CRC, recurrent CRC compared with nonrecurrent CRC, and metastatic CRC compared with primary CRC. d Western blotting analyses performed using human CRC tissues and adjacent nontumor tissues. e IHC staining for SOX12 in human CRC tissues. The scale bars represent 200 µm (upper panel) and 50 µm (lower panel). f Kaplan–Meier analysis revealed a positive correlation between SOX12 expression and tumor recurrence, and a negative correlation with OS. *P < 0.05, **P < 0.01 compared with the control. The data are presented as the mean ± SD

