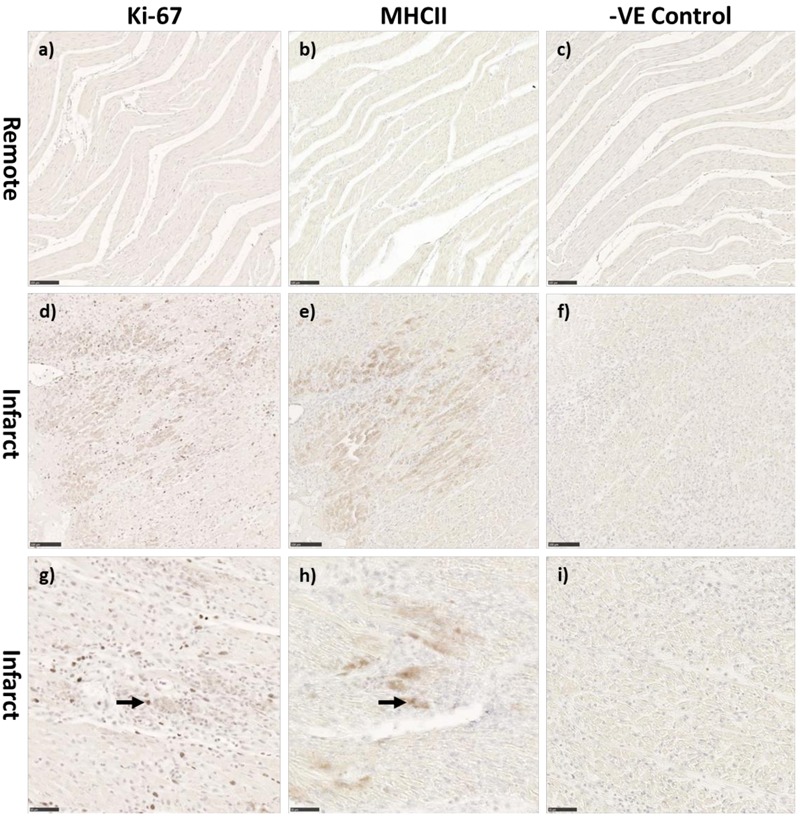
FIGURE 4.

Representative co-localization of Ki-67 and MHC-II staining in the adolescent sheep 3 days after MI. Control remote zone tissue of Ki-67 (a) MHCII (b) and negative control (c) adolescent stained sections (10× Magnification). Infarct area of adolescent Ki-67 (d) MHCII (e) and negative control (f) adolescent stained sections (10× Magnification). Infarct area of adolescent Ki-67 (g) MHCII (h) and negative control (i) adolescent stained sections (20× Magnification). Scale bars 10× magnification = 100 μm, Scale bars 20× magnification = 50 μm. Black arrows represent colocalization of markers.
