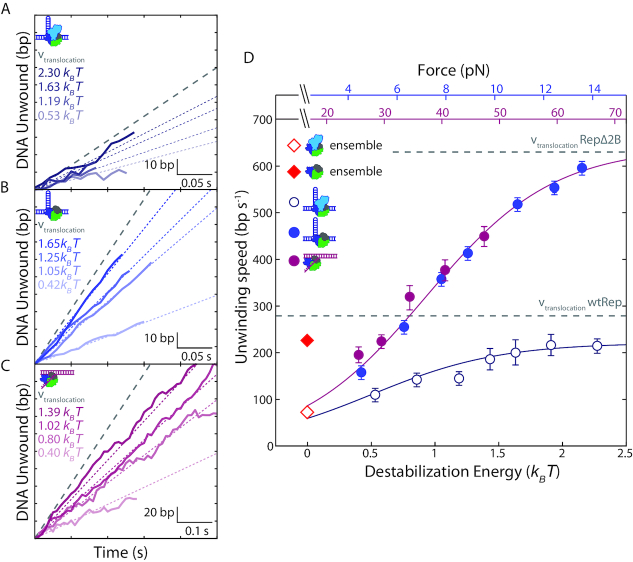
Figure 3.
Effect of duplex destabilization on unwinding speed of RepΔ2B and wtRep. (A–C) Representative sections of hairpin DNA unwinding by wtRep dimer (A, shades of dark blue), hairpin DNA unwinding by RepΔ2B monomer (B, shades of blue), and fork DNA unwinding by RepΔ2B monomer (C, shades of magenta) showing unwinding speed with increasing destabilization energy. Color-coded dotted lines represent mean speed over all traces at the corresponding destabilization energy (see SI Text). The grey dashed line represents wtRep monomer (A) and RepΔ2B monomer (B, C) translocation speeds at zero force. For clarity, all selected traces start at the baseline (0 bp unwound) and extend to the first instance of a pause or a reversal in direction. (D) Mean unwinding speed as a function of destabilization energy for wtRep hairpin (open dark blue circles, N = 6–51), RepΔ2B hairpin (filled blue circles, N = 49–140), and RepΔ2B fork (filled magenta circles, N = 31–73) activity. The average unwinding speeds of wtRep dimer and RepΔ2B monomer at zero force are indicated by the red open and filled diamonds, respectively. The top axes show the forces applied to the hairpin (blue) or fork (magenta), and the bottom axis shows the corresponding destabilization energy. Error bars represent standard error of the mean. The grey dashed lines represent RepΔ2B and wtRep translocation speeds. The solid lines represent a model for the dependence of unwinding speed on destabilization energy for RepΔ2B (magenta) and wtRep (dark blue) (see main and SI text).

