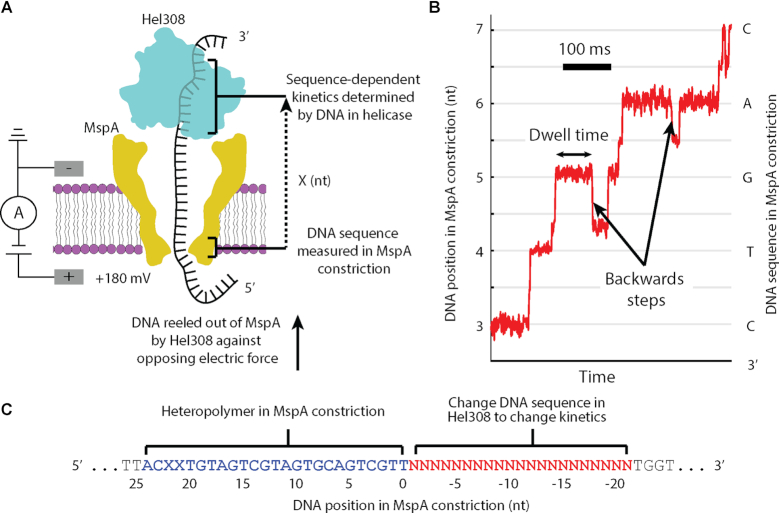
Figure 1.
(A) A single DNA molecule (black) bound to a Hel308 helicase (blue) is drawn into the MspA pore (yellow) by the voltage applied with electrodes (gray). Ion current is measured and used to monitor the progression of a Hel308 helicase along the DNA strand. X represents the distance between the nanopore constriction and the site of sequence dependent effects in the helicase. (B) Position versus time trace for a single Hel308 molecule, with backwards steps indicated. The DNA sequence in MspA nanopore is shown with the associated DNA position. This curve is constructed from the current vs. time data by a non-linear transformation function as described in (13,15,16). (C) DNA design. While Hel308 walks along a 21-nt DNA test sequence (red) that we change to alter Hel308’s kinetics, the heteropolymer measuring sequence (blue) is pulled through the MspA constriction, yielding a high-contrast series of ion current states on which kinetic measurements are made. N is any of A, C, G and T. X in this sequence refers to an abasic site, not to be confused for the distance measurement in panel A.

